
Whole life insurance functions as an asset class of its own: a bond-like return with no market volatility, earned net of mortality and expense charges inside a mutual carrier's general account. The tradeoff is patience, since cash value does not exceed contributions until roughly year five.
The argument over whole life insurance almost never happens at the level of the balance sheet. One side calls it the worst product in personal finance. The other side calls it the only product anyone needs. Both camps skip the question a capital allocator would ask first: what is actually inside the thing, what does it earn, and what does that earning cost.
Tom Wall, who holds a PhD in retirement income planning and spent 15 years inside MassMutual's home office working alongside the actuaries who design these products, put a century of data in front of a room of advisors to answer exactly that. His conclusion was not that whole life is magic. It was narrower and more useful: the returns on a mature policy come from a portfolio of long-duration corporate bonds, and the insurance contract strips out the volatility that comes with owning those bonds yourself.
The case for whole life insurance as an asset class rests on the denominator, not the numerator: same bond-like return, none of the price swings. That is a risk-adjusted argument, and it is the one the quants on Wall Street get paid to solve for. It is also the one most insurance marketing never bothers to make, because it is less exciting than promising tax-free wealth.
At BetterWealth we have structured more than 2,000 policies across all 50 states, and we have watched this strategy work exactly as designed and watched it fail. What follows is the analysis behind Wall's presentation, translated for entrepreneurs, business owners, and high-income earners: where the dividend actually comes from, why the risk-adjusted math holds, the two catches that disqualify most people, and how The And Asset framework governs when borrowing against the policy is worth doing at all.
- Whole life dividend rates track the interest rate environment on a five to ten year lag, not market performance.
- Over the 20 years Wall studied, a mature policy delivered bond-like growth with no mark-to-market volatility and no annual taxation.
- Cash value does not exceed cumulative contributions before year four. Break-even lands at year five or later.
- The dividend rate is gross. Cash value grows at that rate net of mortality and expense charges.
- The And Asset rule governs every loan: borrow only when the deployed capital out-earns the carrier's loan rate.
- Two hard gates disqualify most people from this strategy: health underwriting and a four-year patience window.
Wall walks the room through the actual illustration rows, the bond-yield chart, and the retirement income comparison on screen. If you want to see the numbers move rather than read them, the full presentation is here:
01 / The problemThe 40-year tailwind behind every fixed income allocation is gone
Every bond allocation built between 1981 and 2021 was carried by falling interest rates, and that engine has stopped. When the Federal Reserve pushed the overnight rate to its peak in 1981 to break the inflation of the 1970s, it set off the largest bond bull market on record. Rates fell for four decades. Because bond prices move inversely to rates, existing bonds appreciated the whole way down. A bond bought at 10% became more valuable the moment the market started offering 5%, because its cash flow was better than anything new money could buy.
That produced a generation of bond managers who could do very little wrong. They were deploying capital into an asset class the market was reliably repricing upward. Then 2022 arrived, rates rose fast, and every major financial publication ran the same headline asking whether the 60/40 portfolio was dead. Investors had been lulled into treating the fixed income sleeve as a risk-free anchor. It was not.
Nobody should be predicting rates from here. The relevant point is structural: the fixed income portion of a diversified portfolio is unlikely to repeat what it did for the last 40 years, and it now carries visible price risk. That opens a real question about what else can occupy that slot.
"Bond billionaires were born because they could do no wrong. They were not particularly smart. The market just delivered that for them."
02 / The frameworkWhat does it mean to treat whole life insurance as an asset class?
Treating whole life insurance as an asset class means evaluating the policy on what its cash value actually earns, what risk it carries, and how that combination behaves next to the other holdings on your balance sheet. It means comparing it to the bond sleeve rather than to the stock market, and pricing the death benefit as an explicit annual cost rather than a mystery.
Nelson Nash pioneered a different question. In Becoming Your Own Banker he argued that you either lose money paying interest to outside lenders or you lose it to the opportunity cost of capital sitting idle, and that a whole life policy lets you control the banking function yourself. That insight is the foundation. We credit it in every piece we write.
Where IBC ends and The And Asset begins
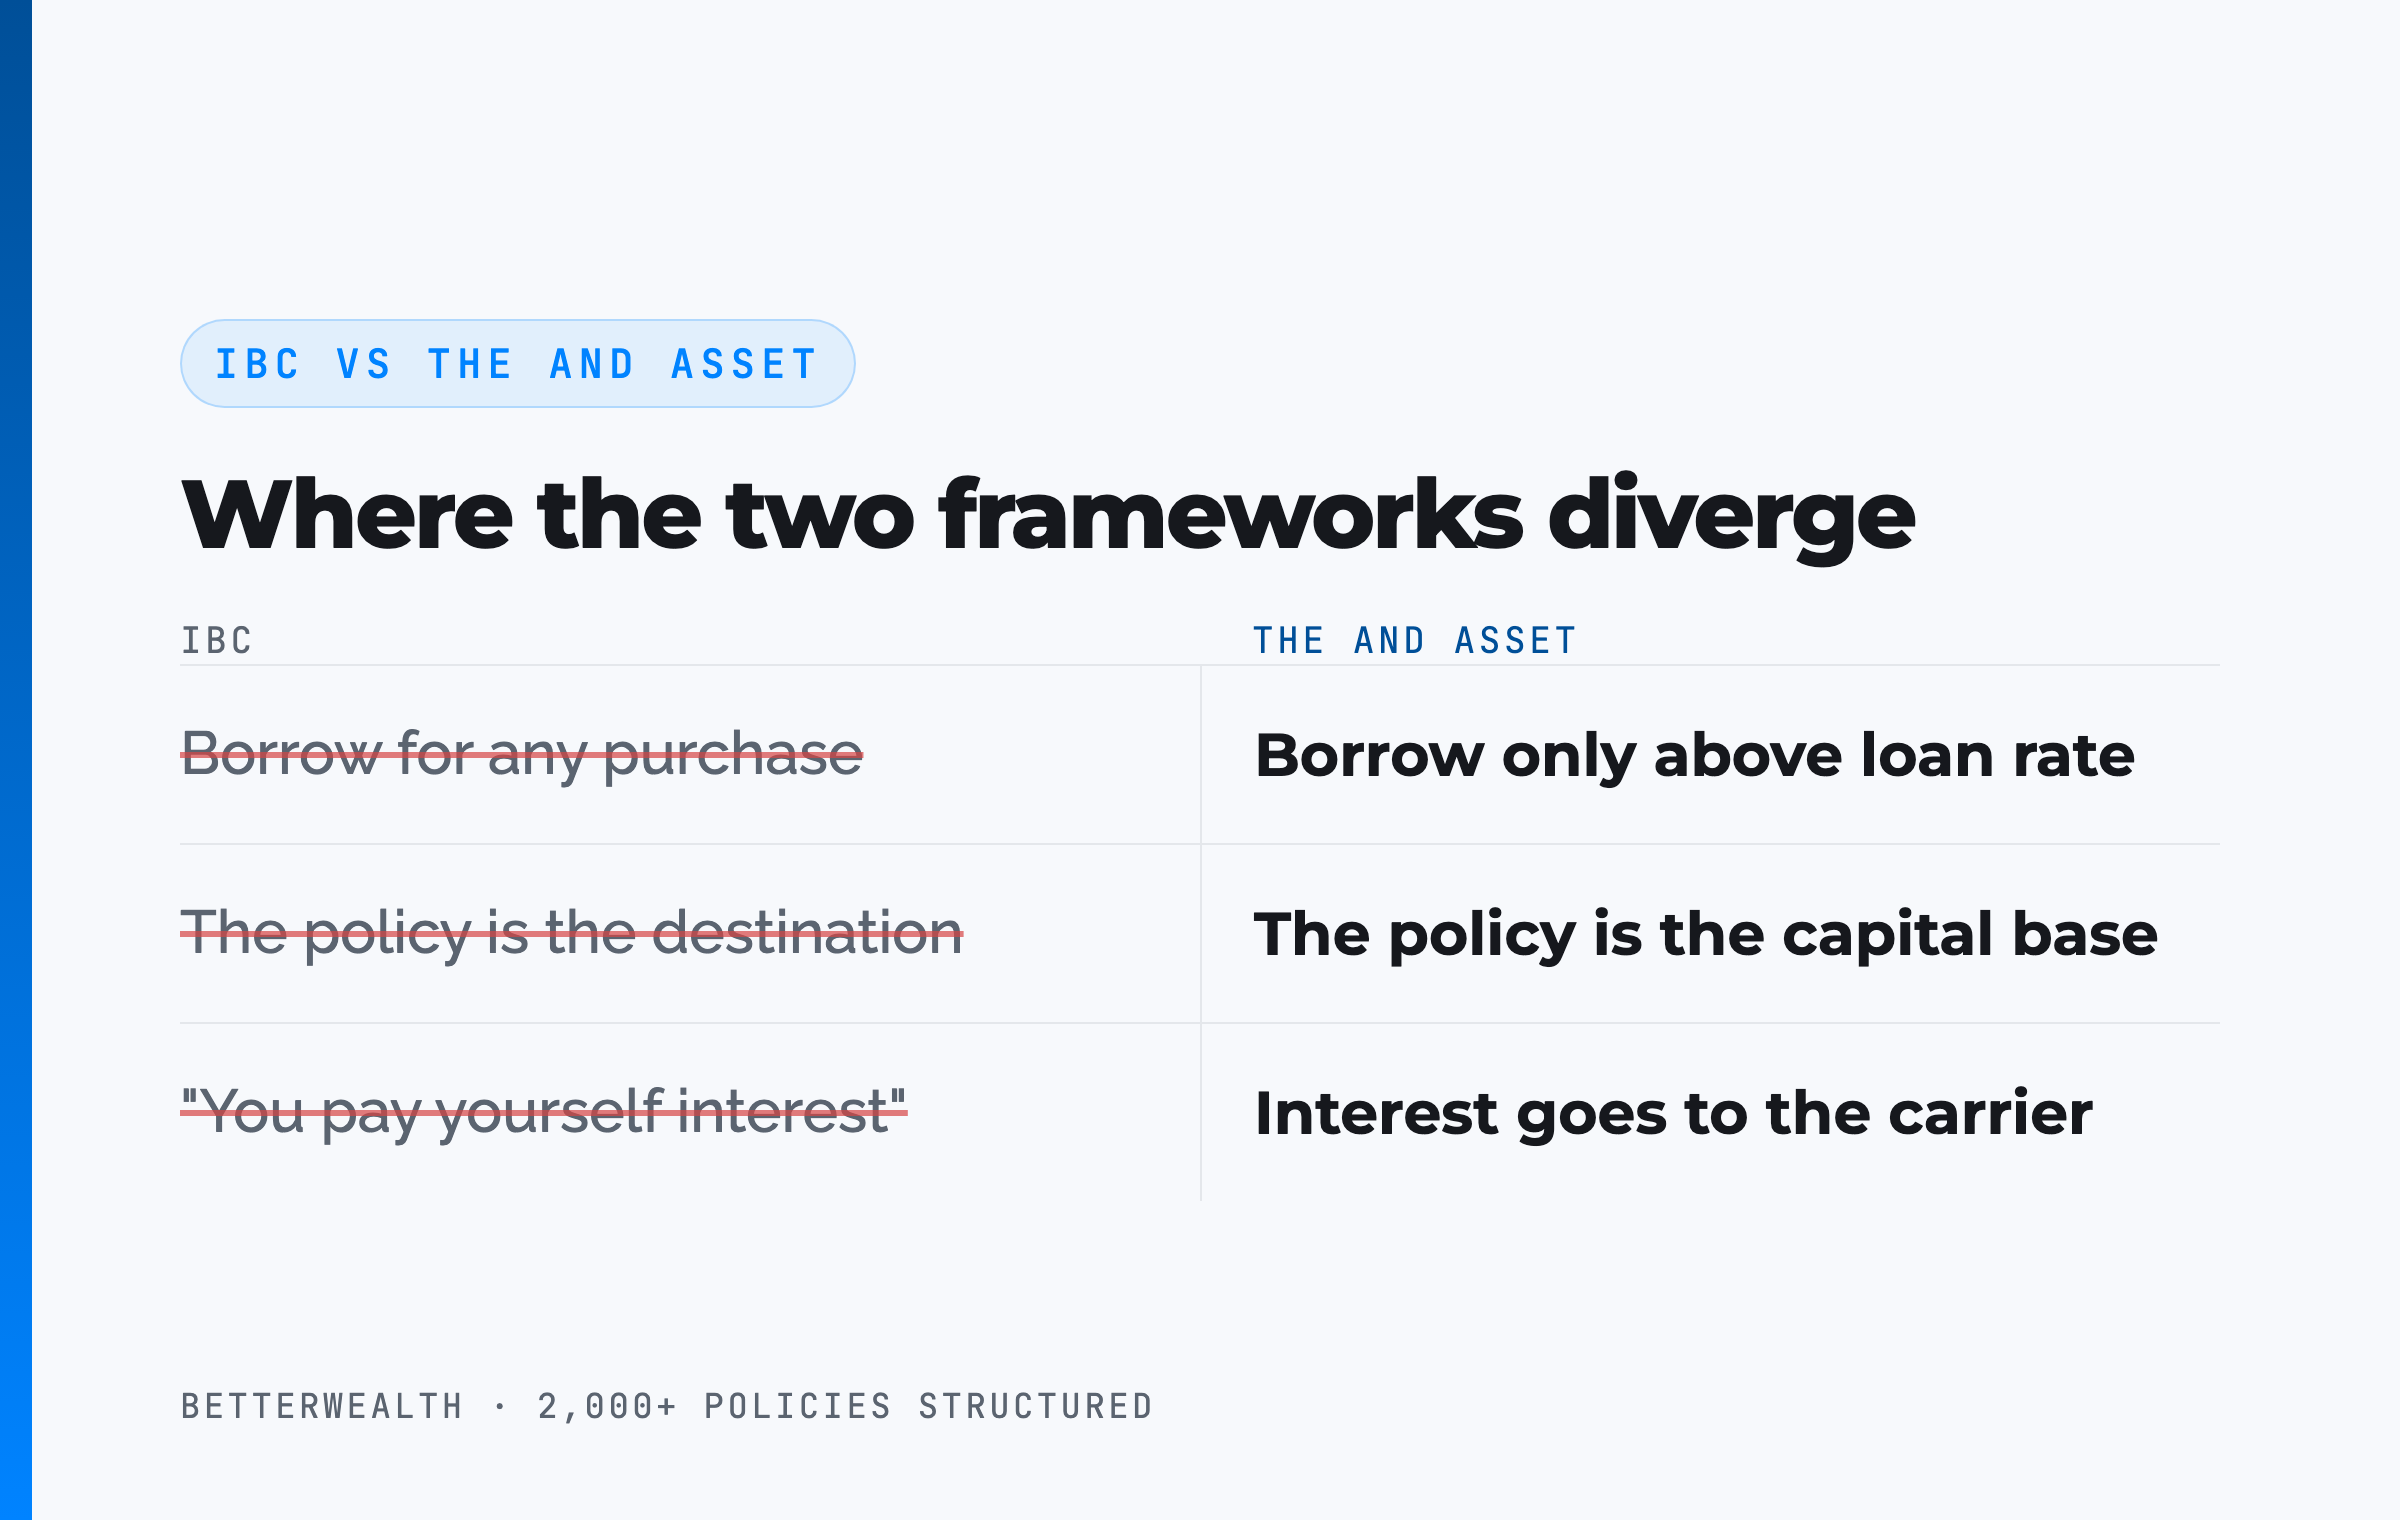
IBC says you can use a whole life policy as a personal banking system for any purchase. The And Asset says you only deploy capital from the policy when the borrowed dollars will produce a return greater than the carrier's loan cost, because anything less is an expensive way to spend money. That single rule is what separates the two frameworks. The And Asset shares roots with IBC and operates on different principles.
Wall arrived at a version of the same idea from the retirement income side. His line about the framework was that it is not either or, it is and. Whole life does not replace the portfolio. It changes what the rest of the portfolio is free to do.
The policy is the capital base. It is not the destination.
Marketers have ruined how this strategy gets explained. You are not paying yourself interest. The interest goes to the carrier, and your return is whatever the deployed capital earns while the policy keeps compounding.
03 / The engineWhere does the dividend actually come from?
The dividend comes out of the carrier's general investment account, which is close to a large, conservatively managed income fund. When a mutual insurer takes in billions of dollars of new and renewal premium, its investment managers put that money at the long end of the yield curve, mostly into long-duration corporate bonds, because longer duration pays a higher yield. Larger carriers add earnings from subsidiaries such as annuity, retirement services, and overseas insurance businesses, which flow up to the holding company and into the dividend pool.
The declared dividend interest rate reflects the weighted average yield across hundreds or thousands of bonds bought at different times and different rates. Carriers call it the portfolio average rate. It is why dividend rates track the interest rate environment on a lag of roughly five to ten years instead of moving with it. As older, lower-yielding holdings roll off and get replaced at current yields, the average moves.
That lag explains the last four decades of declining dividend rates, which had almost nothing to do with carrier performance. It also explains what is happening now. Carriers are reinvesting general account cash flow at roughly double the yields available a few years ago, major mutuals have declared increases for several consecutive years, and that new money is still averaging into the portfolio rate. A policyholder who bought three or four years ago is looking at a better projection today than the one they were shown.
One correction the industry needs to make out loud: the dividend interest rate is gross. Your cash value grows at that rate net of mortality and expense charges. Dividends are declared annually by each carrier's board and are not guaranteed, though every major mutual has paid one every year since the 1800s.
04 / The mathWhy does the risk-adjusted return argument hold up?
The risk-adjusted argument holds because the insurance contract lets you keep the yield of the general account while the carrier absorbs the volatility. If you are wealthy and diversified enough, you can buy the same asset classes the carrier buys. What you cannot do is buy them without the daily mark-to-market swing, and that swing is what forces bad decisions. You do not want to be selling or dying in a down market with depressed asset values.
The carrier does not have that problem. Positive cash flow from renewal premium is predictable, and surplus capital sits in reserve specifically so the company never has to sell into a bad tape. So it keeps rolling money into long-duration holdings at the best available yield, and in exchange for your premium it guarantees the premium can never change, guarantees cash value increases every year, and guarantees a death benefit worth many times what you paid. The only variable left is how much the non-guaranteed dividend enhances those guarantees.
The Sharpe ratio, in plain terms
Wall Street's risk-adjusted return measure divides return by volatility. Whole life cannot improve the numerator. Cash value growth will land in the range of corporate bond yields over time, because that is what the general account holds. Whole life can collapse the denominator, because the contract has no mark-to-market volatility at all. Replace part of the bond sleeve with whole life and you hold portfolio return roughly constant while cutting the variance around it. That is the entire trade, and it is worth understanding before anyone shows you an illustration.
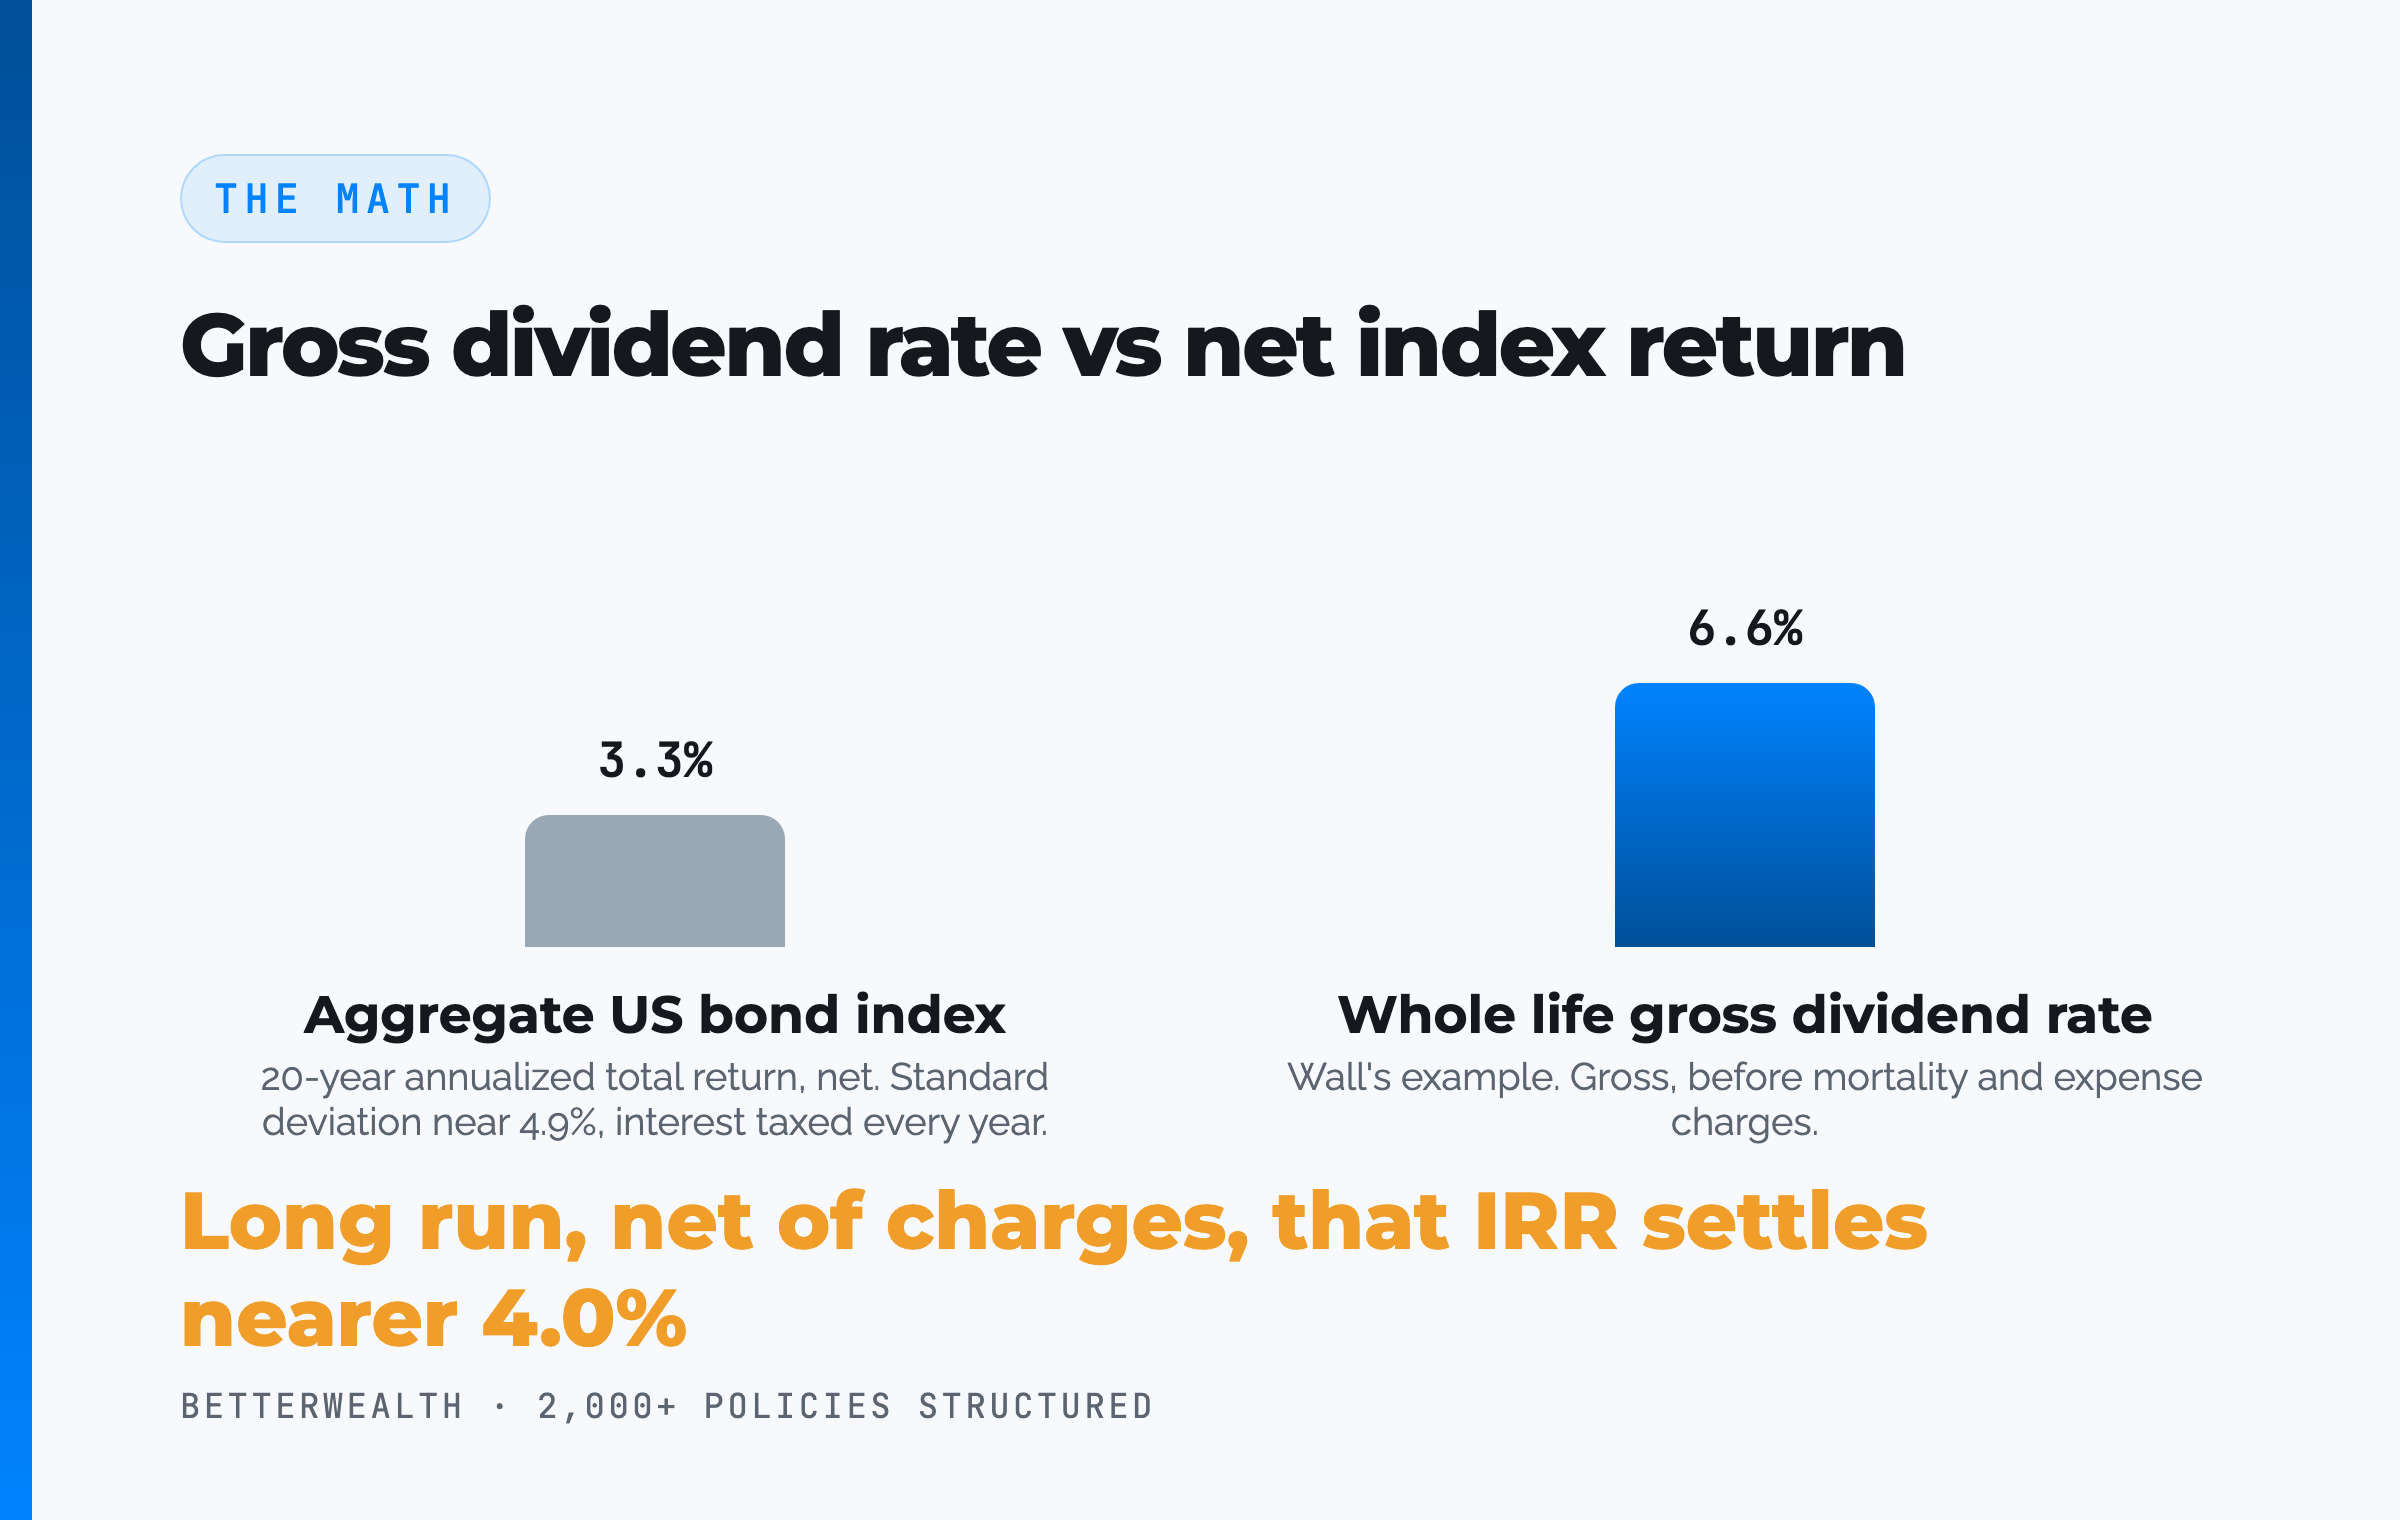
The 20-year comparison Wall ran is the concrete version. The aggregate US bond index returned about 3.3% annualized with a standard deviation near 4.9%, meaning two-thirds of years fell between negative 1.6% and 8.2%. A mature whole life policy over the same window landed in the same neighborhood, modestly above the index once mortality and expense charges came out, with no volatility and no annual taxation on the growth. That comparison applies to a policy already past its capitalization years. It says nothing about year one.
Same return. Half the variance. That is the argument.
05 / How it worksHow does a whole life policy function as an And Asset?
A whole life policy functions as an And Asset through six steps, and the order is not negotiable. Skipping the design step is how people end up with an expensive death benefit and no capital base.
- Qualify on health first. Underwriting is gate one. A policy that never gets issued is not a strategy, so confirm the insured can qualify before designing anything around the capital.
- Design for cash value, not death benefit. Hold the base premium down and load the paid-up additions rider as heavily as the MEC limit allows. Splits commonly run from 40/60 to 10/90 base to PUA depending on the funding horizon. The rider is the engine.
- Size the premium against net worth, not income. Fund from surplus capital you are already setting aside. A common approach moves a fixed slice of annual net worth, often around 2%, into an asset that sits outside the market. On a $1,000,000 net worth that is a $20,000 annual premium.
- Fund through the capitalization years. Cash value trails cumulative contributions early. Around year three or four each premium dollar begins adding more than a dollar of cash value. Break-even, where total cash value catches total contributions, lands at year five or later for a healthy individual.
- Borrow against the policy, not from it. Take a policy loan collateralized by cash value. The policy keeps compounding on its full value net of mortality and expense charges, adjusted for whether the carrier uses direct or non-direct recognition.
- Deploy above the loan rate, then repay. Put the borrowed capital into an activity whose return clears the carrier's loan cost, and repay from the cash flow that activity produces. If nothing clears the loan rate, do not borrow.
Step six is where most people fail, and it has nothing to do with the policy. It is a discipline problem. For the mechanics of what the rider is doing underneath all of this, we broke it down in our guide to paid-up additions.
This is a tool for a specific person doing specific things with capital.
It fits you if
- You already deploy capital and think in IRR
- You can fund consistently for a decade or more
- You are healthy enough to qualify
- You can name a use for capital that beats the loan rate
It does not fit you if
- You need the money back inside four years
- You are carrying high-interest debt right now
- You want a savings account alternative
- You have no productive use for borrowed dollars
If you are in the first column, a 30-minute conversation will tell you what a properly designed policy would actually look like in your situation. If you are in the second, we will tell you that instead.
Book a Discovery Call06 / The catchesWhat are the two things that disqualify most people?
Health and patience disqualify most people, and neither one can be designed around. The first gate is underwriting. Look at the health profile of the average American and it becomes clear this is not a universally available tool, regardless of how it is marketed.
The second gate is the one that kills more policies. Take the illustration Wall put on screen: a 50-year-old funding $20,000 a year on a 10-pay design. Row two shows $40,000 contributed and roughly $20,000 of cash value. That single row is why most people never buy, and no amount of talking about internal rate of return fixes it. Wall's advice to advisors was blunt: stop running the IRR-on-cash-value report entirely, because it loses more sales than it wins.
The honest framing is that the early years are a funding phase, not a return phase. By year three or four the policy has typically reached its capitalization point, where every dollar paid in adds more than a dollar of cash value plus growth. From there the policy shifts from cost to contribution. Ten years in, that same illustration shows more than $200,000 of cash value. What that cash value earns from there is the dividend rate less the cost of the insurance, which is the number the next section takes apart.
The gross rate is not what you earn
The dividend interest rate a carrier declares is a gross number. Mortality and expense charges come out of it, and what is left is what your cash value actually earns. Over the long run an overfunded policy settles closer to 4.0% than to a headline rate near 6.6%. That is a mature-policy rate. The early years run well below it and climb as the policy capitalizes, which is why a return quoted on a young policy means nothing. The difference is not a hidden fee. It is the price of the death benefit sitting above your cash value, and it is the most misquoted number in this category, usually by people repeating the dividend rate as though it were a return. Priced honestly, it is a reasonable number for the coverage. Priced as a mystery, it feels like a black box. Show the arithmetic and the conversation changes. How cash value actually accumulates is worth understanding line by line before you sign anything.
Permanent life insurance is not a need in retirement. Almost nobody needs it. It is a want, and the people who buy it well know exactly what they are buying it for.
07 / Why entrepreneurs use itWhy do capital allocators keep coming back to this?
They come back for access, which is the feature that gets discussed least and matters most. Tax treatment and risk profile are the two attributes people lead with. Access is what actually shows up in a decision.
Consider the tax structure first, stated precisely. Cash value grows tax deferred. Policy loans are generally not treated as taxable income while the policy remains in force and is not classified as a modified endowment contract under IRC Section 7702A. The death benefit is generally received income tax free by the beneficiary. There are no income limits or contribution caps of the kind that apply to a 401(k) or a Roth IRA. What Congress did impose, through Section 7702 and the MEC rules, is a requirement that premium be spread across several years rather than dumped in as a lump sum. In the early 1980s people were putting $1,000,000 into policies with $1.1 million of death benefit, which was tax shelter with a rider attached. The tax treatment itself did not change. The funding pace did. Our breakdown of Section 7702 covers the constraint in detail.
Then the access. A 401(k) restricts withdrawals before age 59½ under rules set by Congress. Home equity requires a lender's approval, and lenders reprice or freeze lines exactly when conditions get difficult. Cash value has neither problem. In the spring of 2020, when equity markets dropped roughly 30% in a matter of weeks, the people with capital tied up in retirement accounts and home equity had one option, which was to wait. Clients holding several hundred thousand dollars of policy cash value did something else. They bought equities at the bottom, and some of them bought property in cities everyone had declared dead. Those assets have appreciated considerably since.
Access is not a feature. It is the whole point.
Nobody would keep $1,000,000 in a savings account in case their house burns down. That is what homeowners insurance is for. So why do retirees hoard an entire portfolio against risks that insurance already prices?
The frameworks behind 2,000+ policies, in one place.
The And Asset Vault holds the calculators, design frameworks, and structuring decisions we use when we build these policies, including the base/PUA splits and the loan-rate threshold math. Free, email-gated, no spam.
Open the Vault08 / The deployment testDoes the return clear the carrier's loan rate?
The return on whatever you deploy must exceed the carrier's loan cost, or you should not borrow. This is the whole test, and everything else in The And Asset framework is downstream of it. Loan rates vary by carrier and by rate environment. At time of writing many carriers sit in the 5 to 6% range, so treat any specific figure as a variable to verify with your carrier rather than a constant.
The structure of the decision is simple to state and hard to hold to. You borrow at the carrier's loan rate. Your policy keeps compounding on its full cash value net of mortality and expense charges, adjusted by the carrier's recognition method. Your deployed capital earns its own return. If that return clears the loan cost, you are ahead on the spread and the same dollar has done two jobs. If it does not, you have borrowed money to lose money slowly.
Notice what this rules out. It rules out borrowing to buy a car you would have bought anyway. It rules out borrowing for a vacation and calling it banking. It rules out most of what gets sold as infinite banking on social media. The math has to work, and when it does not, the correct action is to leave the capital in the policy and let it compound.
A composite: the operator who deployed at year eight
Consider a 44-year-old business owner, preferred non-tobacco, funding an overfunded whole life policy at $63,000 per year on a cashflow design. The premium splits 30/70 base to PUA: $18,900 of base premium and $44,100 into the paid-up additions rider. This is a representative composite built from patterns across our book, not a single named client.
Through the first four years, cash value trails cumulative contributions, which is what a real policy does. Around year four each premium dollar starts adding more than a dollar of cash value. At year five, total cash value crosses total contributions at $318,700 against $315,000 paid in. Any illustration showing that crossover in year two is marketing fiction.
In year eight, cumulative contributions total $504,000 and cash value sits near $561,300, with roughly $533,000 accessible. The owner borrows $214,000 against the policy to acquire a piece of revenue-producing equipment for the business. At an illustrative 6.1% loan rate, first-year loan interest runs $13,054. The equipment produces $29,100 of additional net cash flow in its first year and underwrites to a 13.6% IRR across the hold. The year-one spread is $16,046 in the owner's favor, and repayment runs on a 47-month schedule funded entirely by the equipment's own cash flow.
Through all of it the policy keeps compounding on its full cash value net of mortality and expense charges, adjusted for the carrier's recognition method. The $214,000 never left the policy. It was collateral.
One dollar. Two jobs. That is the And.
09 / The tradeoffsBenefits and the real costs, stated together
The benefits are real and so are the costs, and any presentation that gives you only the first list is selling. Here is the complete version.
On the benefit side: growth that has behaved like corporate bond yields with no mark-to-market volatility, cash value that grows tax deferred, policy loans that are generally not taxable income while the contract stays in force, a death benefit that is generally received income tax free, no contribution ceiling, and access that no lender can freeze or call. Many contracts also allow a portion of the death benefit to be accelerated for qualifying long-term care needs, which solves a second problem with the same asset.
On the cost side: you pay mortality and expense charges every year, which is why the credited rate sits below the gross dividend rate. You give up four to five years of liquidity headroom while the policy capitalizes. You have to qualify medically, and a rating changes the math. And dividends are not guaranteed, so a projection built on today's scale is a projection, not a promise. Wall's own framing of the illustration was that the perceived lack of flexibility and the perceived front-end cost are the two reasons people walk, and both perceptions have a factual basis in the early rows. We cover the full ledger in our honest pros and cons breakdown.
10 / The portfolioHow does this fit a broader capital and retirement income strategy?
It fits by changing what the rest of the portfolio is permitted to do. Wall's central insight from the retirement income research is that the hard problem is not accumulation. It is that people who accumulated successfully refuse to spend. He described meeting a 60-year-old worth $3 million early in his career who was terrified to touch any of it, because it was the last $3 million he would ever have and his skills had gone obsolete.
That fear has a structure. Retirees hoard capital against three risks: leaving nothing to family, needing liquidity for something unforeseen, and long-term care costs. Longevity multiplies all three. So they draw 4% or less from a portfolio and call it prudent, which Morningstar priced at 3.9% for 2026. On $2,000,000 that is $78,000 a year, with a large balance held in reserve against events that insurance already prices.
Now change the composition. Suppose that same person arrived at retirement with $1,600,000 in the retirement account instead of $2,000,000, because roughly 20% of the accumulation went into a whole life policy along the way. That policy carries a $1,200,000 death benefit with $1,000,000 of it accessible for qualifying long-term care. Legacy is solved. Liquidity is solved. Long-term care is solved. Which means the $1,600,000 can now be converted into guaranteed lifetime income through an annuity, because the reasons to hold it back are gone. At the cash flow rates available at time of writing, that produced roughly 67% more spendable income than the $78,000 the conventional plan generated.
Why this is a location decision, not a return decision
Half a percent of additional return at age 58 barely changes the outcome. Retiring with $3.3 million instead of $3.1 million is the same retirement. But moving a portion of the same capital into a different structure, so that a different set of guarantees becomes available, can change how much of it you are willing to spend. That is a location decision, and it is where the leverage is at that stage of life. The And Asset framework treats the accumulation years the same way: the policy is a capital base whose value shows up in what it lets you do elsewhere.
The return matters less than what the return unlocks.
A Monte Carlo run makes 10,000 randomized projections off the last 100 years, the greatest economic expansion any nation has ever had. A 98% success rate still means a one in 50 chance the plan fails. Nobody boards a plane on those odds.
11 / Head to headWhole life against the alternatives it actually competes with
Whole life competes with the conservative sleeve of a portfolio, not with equities, and the comparison only makes sense against the holdings it would displace. The table below sets a mature And Asset policy against the aggregate bond index, a 401(k), and a cash reserve on the four dimensions that decide capital strategy. Policy figures are illustrative and assume a policy past its capitalization years.
| Dimension | Mature And Asset policy | Aggregate bond index | 401(k) | Cash reserve |
|---|---|---|---|---|
| 20-year growth on $100,000 | About $219,000 at a 4.0% net cash value return, after internal charges (illustrative, dividends not guaranteed) | About $191,000 at the 3.3% annualized index return, before tax on interest | Market-dependent, tax-deferred until withdrawal | About $219,000 at 4.0%, before tax; roughly $174,000 after tax at a 37% bracket |
| Volatility | None. Cash value is contractually guaranteed to increase every year | Standard deviation near 4.9%; two-thirds of years between negative 1.6% and 8.2% | Full equity and bond market volatility | None, but purchasing power erodes with inflation |
| Tax treatment | Tax-deferred growth; loans generally not taxable income; death benefit generally income-tax-free | Interest taxed annually as ordinary income | Deferred now, taxed as ordinary income on withdrawal | Interest taxed annually as ordinary income |
| Access | Policy loan against cash value; cannot be called or frozen by the carrier | Liquid, but you may be selling at a loss when you need it | Restricted before 59½ (penalty plus tax) | Immediate and complete |
Growth. The policy figure and the index figure are not equivalent claims. The index return is historical fact over the window Wall measured. The policy figure is a projection net of internal charges, and dividends are declared annually by the carrier's board rather than guaranteed. Notice that the policy does not win this row by much. That is the honest result, and it is the whole point: the case here is not a higher return, it is a similar return with no volatility and no annual tax drag.
Volatility and tax. The bond index delivered its 3.3% with real price swings and with interest taxed every year at ordinary rates. The policy delivered its growth with no swings and no annual tax drag. Those two differences compound quietly over 20 years, and they are the actual source of the gap in the first row.
Access. Cash is the only column that beats a policy loan on speed, and cash pays for that with erosion. The 401(k) column is the one worth staring at: a $2,000,000 balance producing $78,000 a year is capital doing one job. That is the constraint The And Asset is built to remove.
We tell more people no than yes.
We have structured more than 2,000 policies across all 50 states, and we have seen this work exactly as designed and seen it fail. On a discovery call a practitioner looks at your actual balance sheet and tells you whether a properly designed policy belongs in it. We will tell you if it does not. If you would rather learn first, the The And Asset and BetterWealth YouTube channels go deep on the math.
Book a Discovery CallFAQWhole life insurance as an asset class: common questions
Is whole life insurance an asset class?
Whole life insurance behaves like its own asset class because its returns come from a mutual carrier's general account, which is invested mostly in long-duration corporate bonds, while the contract removes the mark-to-market volatility. You get bond-like growth net of mortality and expense charges without the price swings, which is a different risk profile than owning the bonds directly.
What is The And Asset?
The And Asset is BetterWealth's framework for using a properly structured whole life policy as a capital base. You only borrow against it for an activity that produces a return greater than the carrier's loan cost, so your dollars do two jobs at once: the policy keeps compounding net of internal charges while the deployed capital earns its own return.
How is The And Asset different from infinite banking?
Infinite banking, as Nelson Nash taught it, frames a whole life policy as a personal banking system you can use for any purchase. The And Asset adds a discipline Nash's broader teaching does not enforce: you only deploy borrowed capital when the return clears the carrier's loan cost. The policy is the capital base, not the destination. It shares roots with IBC but operates on different principles.
Where does a whole life dividend actually come from?
The dividend comes from a mutual carrier's general investment account, which is funded by new and renewal premiums and invested at the long end of the yield curve, mostly in long-term corporate bonds, plus earnings from the carrier's subsidiaries. The declared dividend interest rate reflects the weighted average yield of that portfolio, called the portfolio average rate, which is why it tracks the interest rate environment on a lag of roughly five to ten years.
Why are whole life dividend rates rising in 2026?
Dividend rates are rising because carriers are now reinvesting general account cash flow at yields far above what was available during the low-rate years, and that higher yield averages into the portfolio rate over time. Major mutuals have declared increases for several consecutive years after roughly four decades of decline. Dividends are declared annually by each board and are not guaranteed.
Does whole life insurance really outperform bonds?
Over the 20-year window Tom Wall examined, the aggregate US bond index returned about 3.3% annualized with a standard deviation near 4.9%. A mature whole life policy landed in the same range, modestly above it once mortality and expense charges came out, and it did so with no mark-to-market volatility and no annual tax on the growth. The advantage is the risk and tax profile, not a dramatically higher return. That comparison applies to a policy already past its capitalization years. A newly issued policy has not yet reached break-even and should not be compared to a bond index.
When does a whole life policy break even?
Cash value catches cumulative contributions at year five or later for a healthy individual in a well-designed policy. Around year three or four the policy reaches its capitalization point, where each premium dollar adds more than a dollar of cash value, but that is not the same as break-even. Any illustration showing break-even in year one or two is fiction.
Why is my cash value growth lower than the dividend interest rate?
The dividend interest rate is gross. Your cash value grows at that rate net of mortality and expense charges, which pay for the death benefit sitting above your cash value. The gap is wider than most presentations admit: over the long run, cash value growth net of those charges settles closer to 4.0% than to a headline rate near 6.6%. That is a mature-policy rate, not one the early years produce. That difference is the price of the coverage, not a hidden fee, and any presentation quoting the dividend rate as your return is quoting the wrong number.
Are policy loans taxable income?
Policy loans are generally not treated as taxable income while the policy stays in force and is not classified as a modified endowment contract under IRC Section 7702A. Cash value grows tax deferred, and the death benefit is generally received income tax free by the beneficiary. Lapsing a policy with an outstanding loan can trigger a taxable event, so the loan discipline is part of the tax treatment, not separate from it.
What are the real downsides of whole life insurance?
There are two hard gates and one structural cost. You have to be healthy enough to qualify, you have to be patient enough to fund through four or five years of the policy trailing your contributions, and you pay mortality and expense charges every year for the death benefit that sits above your cash value. If you cannot clear all three, this is the wrong tool.
Who is whole life insurance not for?
It is not for someone early in building wealth, someone who needs the money back inside four years, someone carrying high-interest debt looking for a fast fix, or someone who cannot name a use for borrowed capital that beats the carrier's loan rate. Permanent life insurance is a want in retirement, not a need, and treating it as universally applicable is how the strategy gets oversold.
How much of my net worth should go into a whole life policy?
There is no universal number, but the framing Tom Wall uses in practice is a fixed slice of annual net worth moved into an asset that sits outside the market, often around 2% per year. On a $1,000,000 net worth that is a $20,000 annual premium. The allocation should come from capital you are already setting aside, never from the cash your business or household needs to operate.
Can whole life insurance improve retirement income?
It can, because it removes the reasons retirees refuse to convert assets into income. A policy that covers legacy, liquidity, and long-term care frees the rest of the portfolio to be spent or annuitized instead of hoarded against catastrophic risk. In the scenario Tom Wall presented, a retiree holding $1.6 million plus a policy with a $1.2 million death benefit produced roughly 67% more income than a comparable retiree drawing 4% from $2 million.
- Nelson Nash, Becoming Your Own Banker, the origin of the infinite banking concept and the foundation The And Asset builds on.
- IRC Section 7702 (Cornell Law) and Section 7702A, the provisions governing the definition of a life insurance contract and modified endowment contract classification.
- Federal Reserve Economic Data: 10-Year Treasury Constant Maturity Rate, the series behind the 1981 peak and the four-decade decline.
- Morningstar retirement research, source of the annually published safe withdrawal rate.
- LIMRA and AM Best, life insurance industry data and carrier financial strength ratings.
- BetterWealth resources: The And Asset book, the The And Asset YouTube channel, and the BetterWealth YouTube channel.
- Source video: The Truth About Whole Life Insurance, According to 100 Years of Data, with Tom Wall, PhD.
Holds a PhD in retirement income planning and spent 15 years at MassMutual's home office, including work alongside the chief actuaries on product design and a period leading the marketing team responsible for carrier illustrations. He now speaks to financial advisors about positioning participating whole life insurance and annuities inside a retirement plan, and authored a book on the subject.
I founded BetterWealth to treat life insurance as the wealth and capital tool it actually is, not the product most people get sold. Our team has structured more than 2,000 policies across all 50 states. I wrote The And Asset and host the BetterWealth and The And Asset YouTube channels. If you want an honest read on whether a properly designed policy belongs on your balance sheet, book a discovery call. We will tell you if it does not.