
The academic case for whole life insurance rests on three findings: the terminal reserve is money held toward a future death benefit rather than money the carrier keeps, peer-reviewed retirement research shows coordinated plans producing 30 to 54% more income than buy-term-and-invest-the-difference, and lost opportunity cost is measurable.
Almost every public argument about whole life insurance is conducted without three things: the mechanics of how the contract works, the research on how it behaves inside a retirement plan, and an agreed definition of the word cost. Strip those away and the debate becomes a comparison of two numbers, a $188 term premium against a $4,015 whole life premium, which settles nothing.
The strongest case for whole life insurance is technical, and almost nobody makes it, because making it requires understanding a reserve calculation, a body of retirement income research, and a cost measurement most of the financial planning profession ignores. Each of those three has a defensible answer. Together they explain why the loudest critics of this asset class keep arriving at conclusions their own evidence does not support.
At BetterWealth we have structured more than 2,000 policies across all 50 states, and we spend more time correcting bad arguments in favor of whole life than arguments against it. Marketers have ruined how this strategy gets explained. That is why we built The And Asset as a distinct framework with a rule attached, and why a conversation grounded in reserve mechanics and peer-reviewed research is worth four hours of anyone's time.
This piece covers what a terminal reserve is and why it ends the most common attack on permanent insurance, why whole life and universal life keep getting conflated in these debates, what three retirement income studies actually measured, how lost opportunity cost is defined and where the definition breaks down, and where The And Asset draws a line that neither side of the usual argument draws.
- The terminal reserve is money set aside toward your death benefit. The carrier does not keep your cash value.
- A level premium is only possible because the carrier overcharges early to fund higher mortality cost later.
- Most critiques of whole life describe universal life mechanics: itemized fees, rising cost of insurance, and lapse risk.
- In median scenarios, coordinated plans using whole life produced 30 to 54% more retirement income than buy-term-and-invest-the-difference.
- Premium and cost are different numbers. A $188 term premium carried roughly $24,000 per year of lifetime economic cost.
- The And Asset rule still governs: borrow only when the deployed return clears the carrier's loan cost.
The article gives you the findings. The recording gives you Dan working through the reserve diagrams, the study tables, and the compound interest curves on screen, including the long stretch where Caleb refuses to accept his lost opportunity cost math and the two of them argue it out on camera.
Dan Flanscha passed away after these sessions were recorded and before they were released. He was a CFP, CLU, ChFC, RICP, and LUTCF with nearly 40 years in the life insurance industry, and he spent much of that career training agents and teaching continuing education to CPAs.
Education was the thing he cared about most. Releasing the full conversation without a paywall is how we chose to honor that. Everything below comes from those sessions.
01 / The problemWhy do whole life debates keep producing the wrong answer?
Whole life debates produce the wrong answer because the two sides are usually evaluating different products. One side describes a contract with monthly fees, a cost of insurance charge that climbs with age, and a real chance of lapsing. The other side describes a contract with a level premium, guaranteed cash value, and dividends. Both descriptions are accurate. They are descriptions of two different chassis.
Universal life is built on an accounting chassis. Open an annual statement and you get a ledger: premiums paid, fees deducted, interest credited, cost of insurance charged. Every component is itemized because the product is assembled from separable parts. Whole life amortizes those same economic realities into the contract on day one and never breaks them out.
When a critic says the policy is riddled with fees and expenses that compound against you, they are reading a universal life statement. When they say the strategy is built on whole life, they are describing something else. The gap between those two statements is where most of the public argument lives.
"Are they evaluating whole life, which is supposed to be what infinite banking is based on, or are they using universal life? I don't think we ever do figure that out."
02 / The mechanicsWhat is a terminal reserve, and why does it settle the biggest objection?
A terminal reserve is the amount the carrier is required to set aside each year toward your policy's future death benefit, and it is the same thing you know as cash value. Understanding it settles the loudest objection to permanent insurance, the claim that the insurance company keeps your cash value when you die.
Start with why the reserve has to exist. There are three ways to pay for life insurance. You can rent coverage year to year on annual renewable term, in which case the price climbs every twelve months because you are twelve months closer to a claim. You can pay a higher price early so the premium can stay level for life, which is whole life. You can pay higher still for a shorter window and stop, which is limited pay. Level term is the same mechanic compressed into 10, 20, or 30 years.
The reserve and the net amount at risk
In every case where the premium is level, the carrier is collecting more than the current mortality cost in the early years and setting the surplus aside. That surplus is the reserve. As the reserve grows, the carrier's exposure shrinks. On a $1,000,000 death benefit with $200,000 of cash value, the carrier's net amount at risk is $800,000, and that is the only portion they are pricing mortality against. You are not paying insurance charges on your own reserve. It has already been allocated to you.
Now the objection collapses. At death the carrier pays the reserve, which is your money held toward the claim, plus the net amount at risk, which is their money. Together they equal the death benefit. Nothing was confiscated. The reserve was always a deposit toward the payout. On a universal life statement you can watch this happen line by line. On whole life the same principle is amortized across the life of the contract without an itemized ledger.
The reserve is not a fee. It is the mechanism.
This is also the part of the industry's own defense that gets fumbled. The standard rebuttal reaches for paid-up additions, arguing that the death benefit grows faster than contributions so the cash value question does not matter. That is a weak answer to a strong claim. The correct answer is structural: the reserve plus the net amount at risk is what makes permanence possible in the first place. Cash value mechanics are worth understanding before anyone argues about them.
"When you die, they're going to pay you your cash value back, because it was like a deposit to the future death benefit, and they're going to pay the risk that they are assuming."
03 / The frameworkWhere the academic case ends and The And Asset begins
The academic case establishes that whole life works as designed. It does not establish that you should own one, and that distinction is the entire reason The And Asset exists as a separate framework.
Nelson Nash pioneered the use of whole life insurance as a personal banking system in Becoming Your Own Banker. His insight holds: you either lose money paying interest to outside lenders or you lose money to the opportunity cost of capital sitting idle. That foundation is real and we credit it every time we write about this.
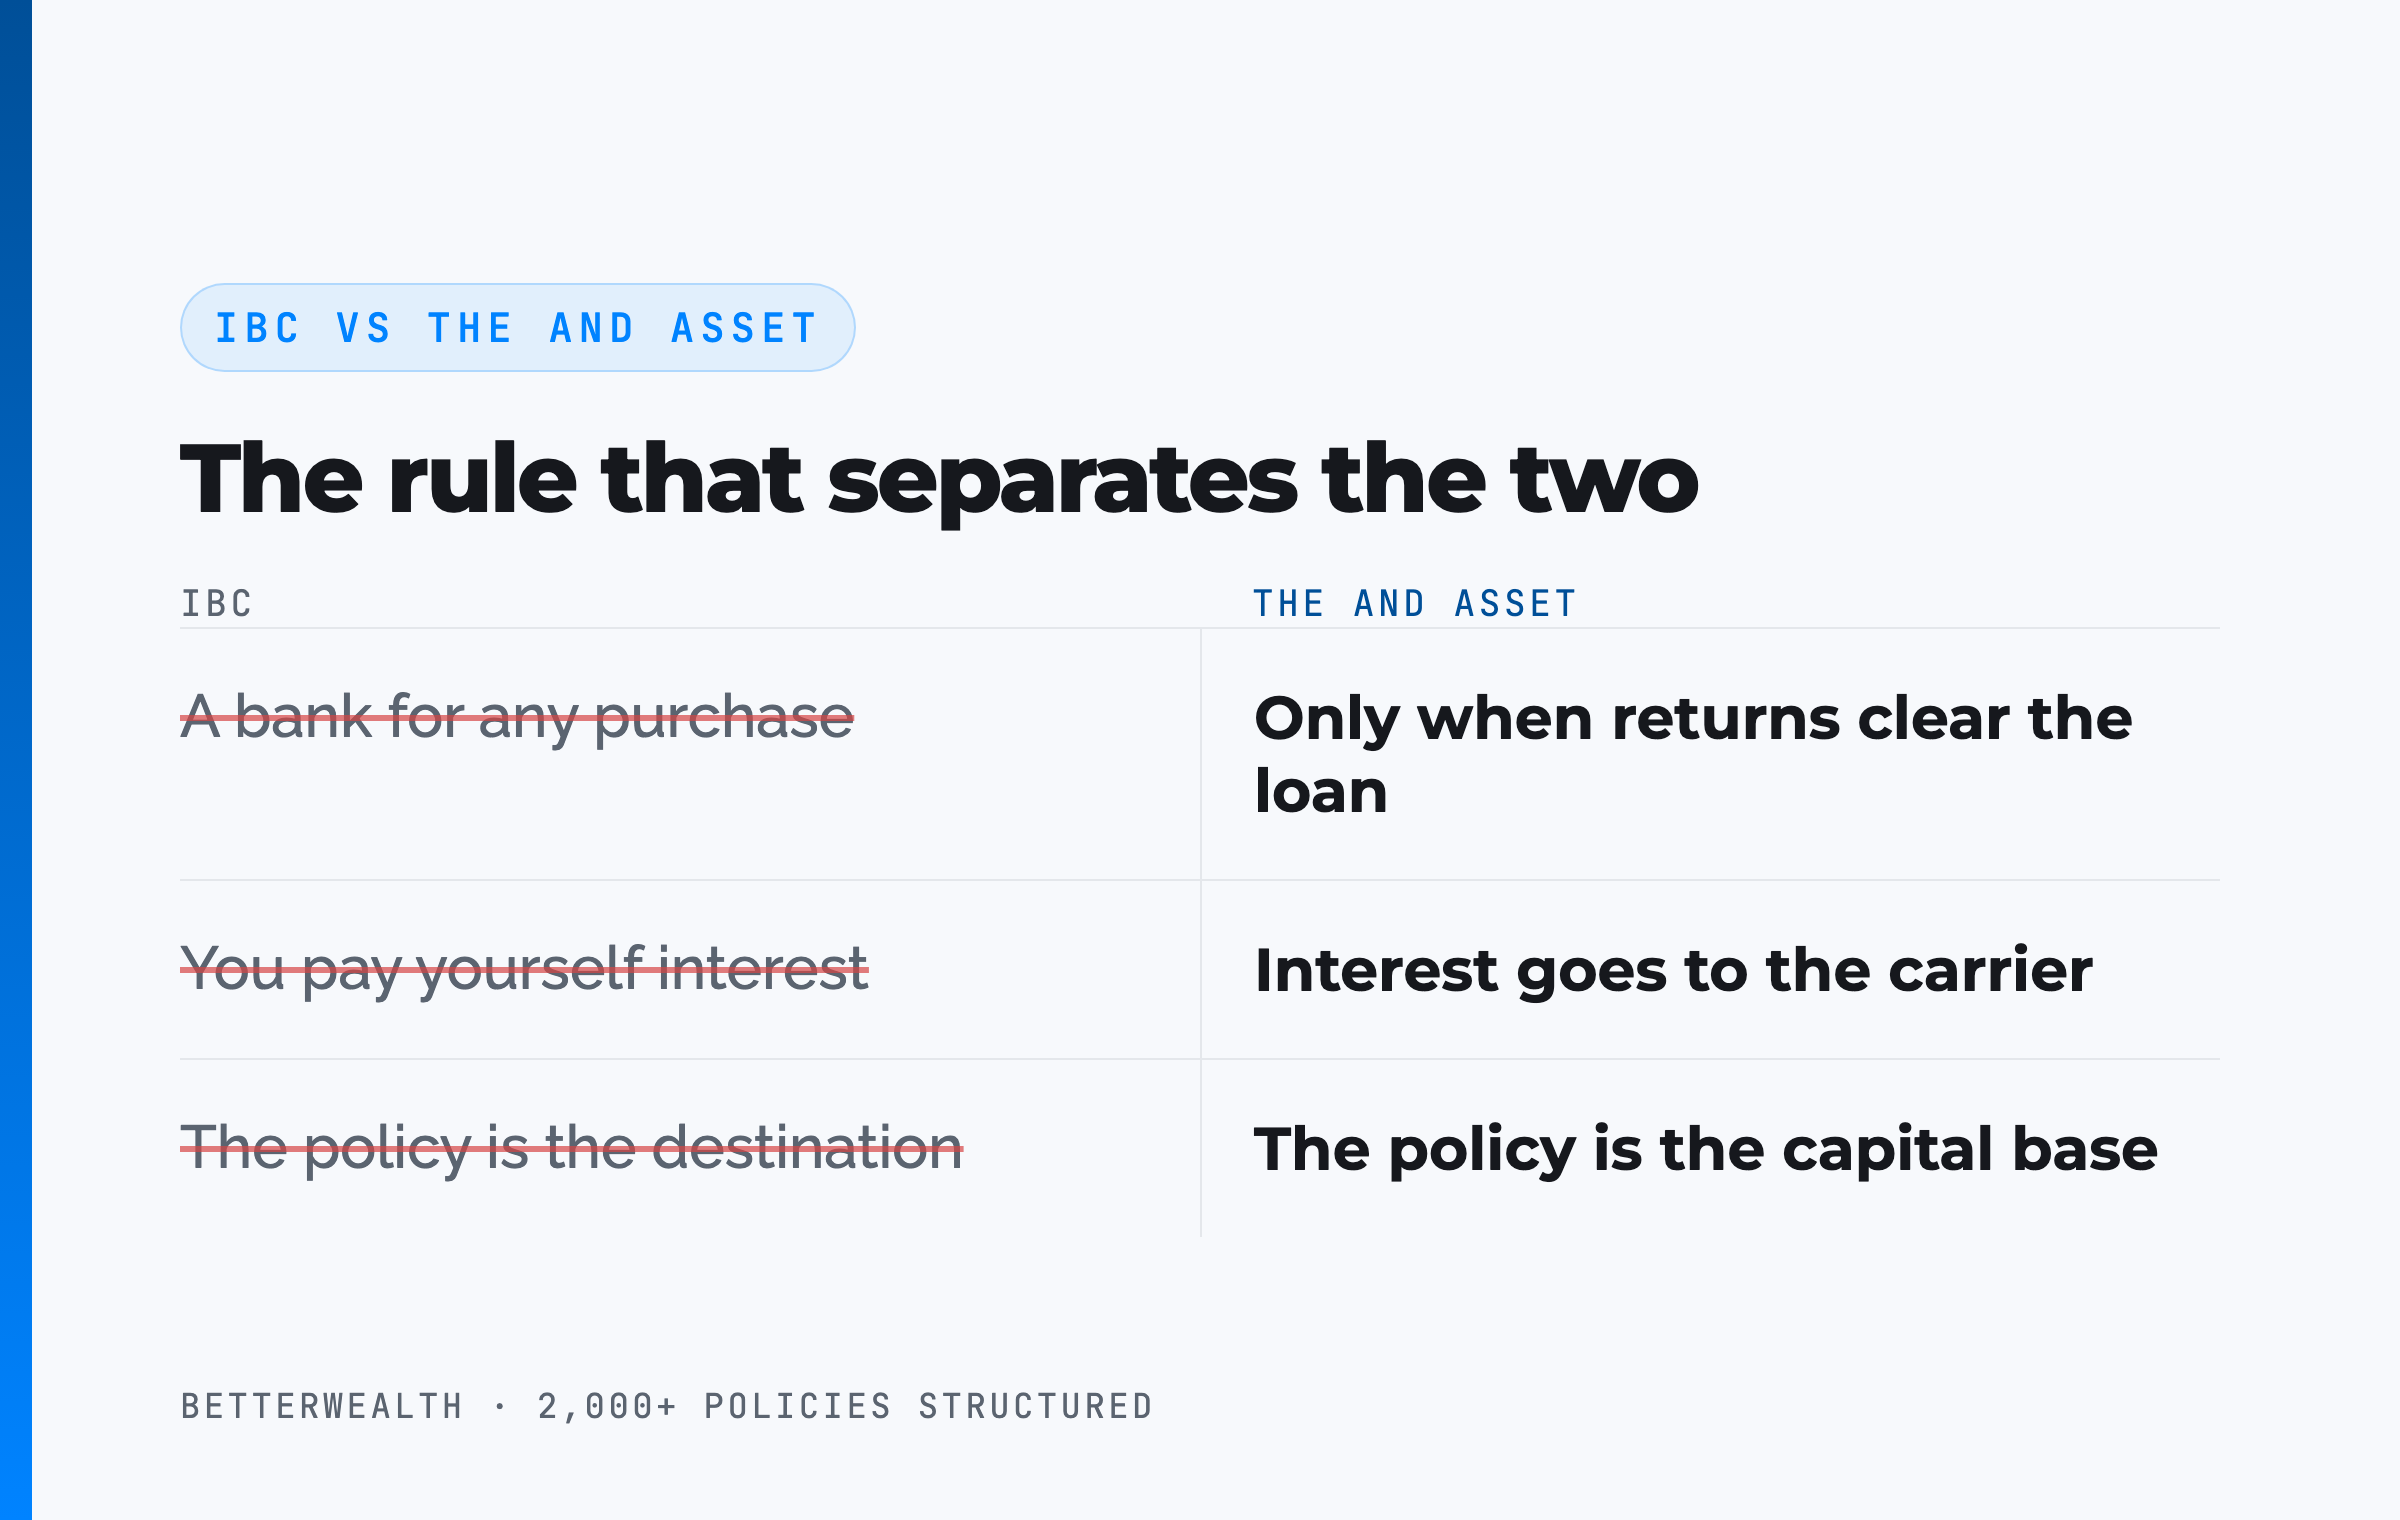
IBC says a whole life policy is a personal banking system you can use for any purchase. The And Asset says you only deploy capital from the policy when the borrowed dollars will produce a return greater than the carrier's loan cost, because the loan interest goes to the carrier and nowhere else. You are not paying yourself interest. Your return is what the deployed capital earns while the policy keeps compounding net of mortality and expense charges. If you cannot identify a use that clears the loan cost, do not borrow. That rule is the difference between the two frameworks, and it is why The And Asset shares roots with IBC but operates on different principles.
The research below strengthens the case for owning permanent insurance. The And Asset governs what you do with it after you own it.
04 / How it worksHow a whole life policy functions as an And Asset
A whole life policy functions as an And Asset through six mechanical steps, and the order matters more than any single step.
- Structure for cash value. Minimize the base premium and load the paid-up additions rider as heavily as the tax code allows without tripping the Modified Endowment Contract limit. The base-to-PUA split, written 25/75 or 40/60, is the design decision that drives early cash value. A paid-up addition is a single premium payment into a very small whole life policy, complete with its own reserve.
- Understand what the premium is funding. Part of every dollar builds the terminal reserve. As the reserve grows, the net amount at risk shrinks, which is what holds the premium level for life. Nothing about this changes with age.
- Let the early years capitalize. Cash value does not exceed cumulative contributions before year four. Break-even for a healthy individual lands at year five or later. Any illustration showing year-one or year-two break-even is fiction, and the agent showing it is either careless or selling.
- Borrow against the reserve rather than withdraw from it. A policy loan comes from the carrier's general account with your cash value pledged as collateral. The cash value and death benefit stay in force. This is the feature term insurance structurally cannot offer, because you have no access to the reserves inside a term contract.
- Pay the loan interest annually. Letting interest capitalize drags the policy backward. Paying it each year keeps both curves, cash value and death benefit, moving from where they are.
- Deploy into a return that clears the loan cost, then repay. Loan rates vary by carrier and rate environment. At the time of writing many carriers fall in the 5 to 6% range, but treat the specific number as a variable to verify, not a constant.
One precision note on step five, because this is where the industry gets sloppy. Under a non-direct recognition carrier, paying the loan interest means the policy performs as though you never borrowed. Under a direct recognition carrier, the dividend credited on the borrowed portion is adjusted by the carrier's spread, so the effect is close but not identical. Either way you stay on the same compounding curve instead of starting a new one, which is the point. Policy structure determines how much of this you actually get.
Two curves. Cash value and death benefit. Neither one restarts.
The research makes the case. It does not make the decision.
It fits you if
- You already deploy capital and think in IRR
- You have a 10-year-plus funding horizon
- You can name a use for capital that beats the loan cost
- You want the plan to work in every market, not the lucky one
It does not fit you if
- You are early in building wealth
- You want a savings account alternative
- You are carrying high-interest debt and need a fast fix
- You have no plan for the borrowed dollars
If you are in the first column, 30 minutes will tell you whether the design math works for your situation. If you are in the second, we will tell you that instead.
Book a Discovery Call05 / The researchWhat does the peer-reviewed retirement research actually show?
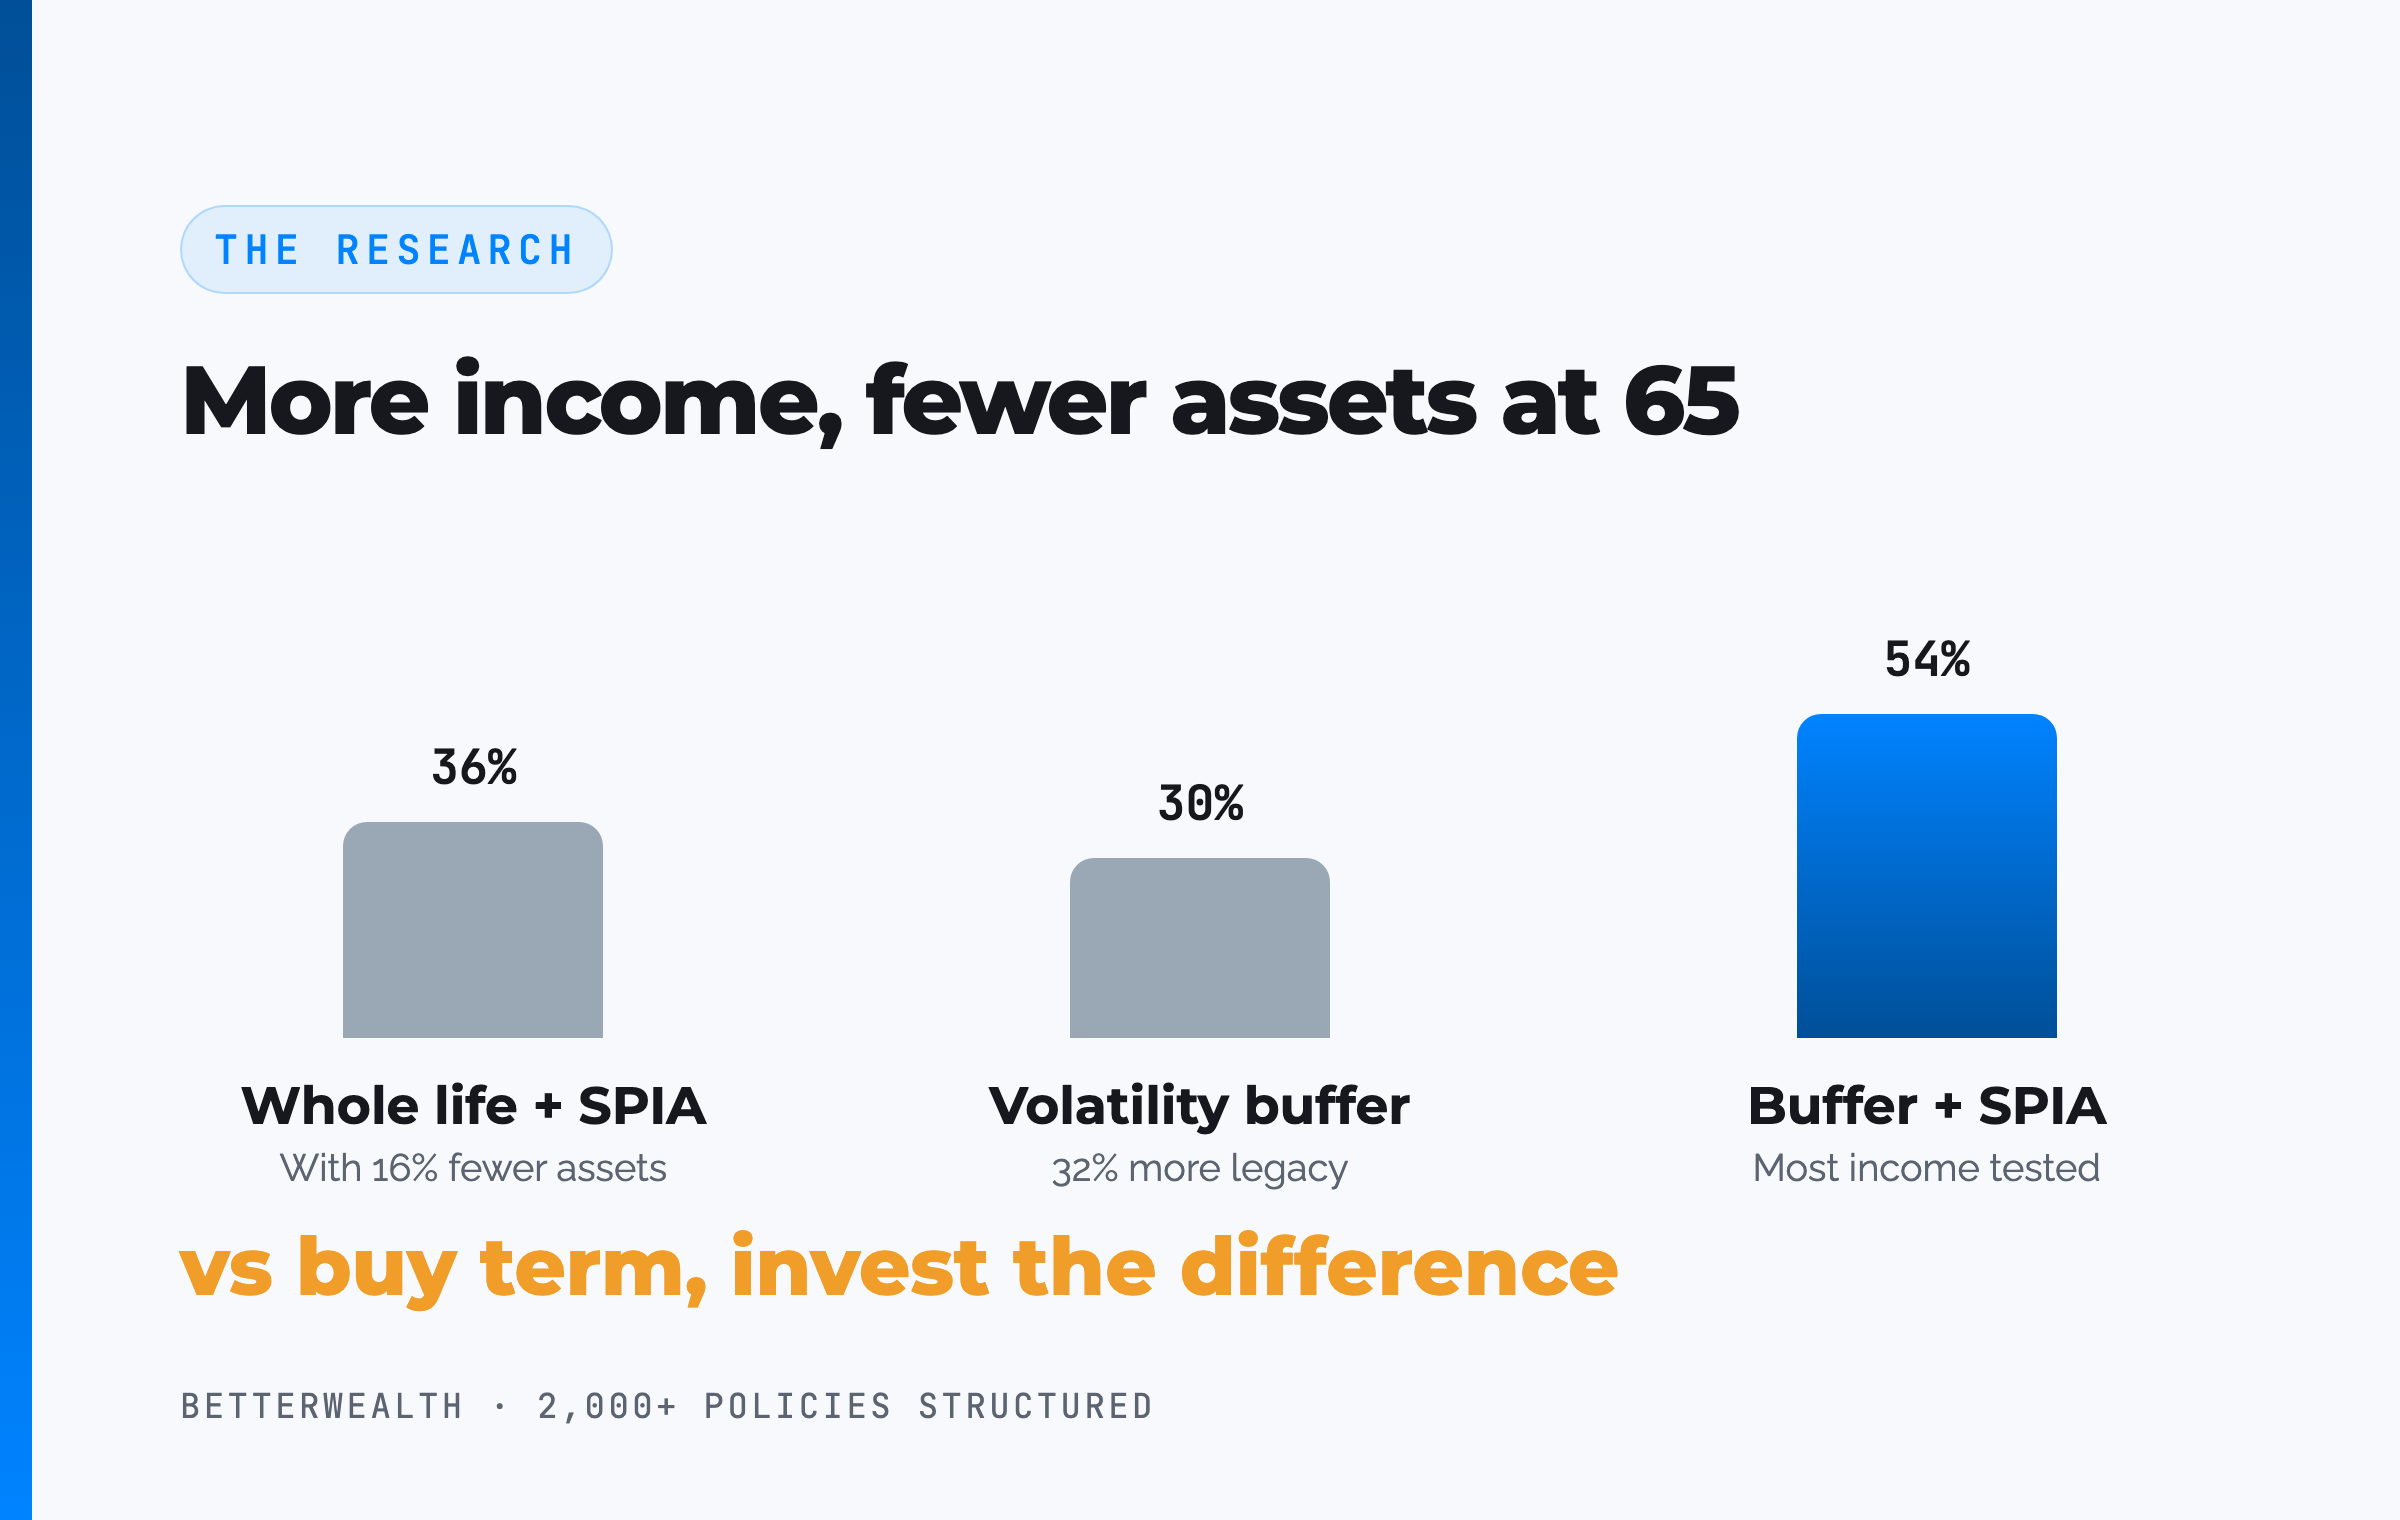
The research shows that coordinated plans holding fewer assets at retirement produce more retirement income and, in most scenarios, a larger legacy than investment-only plans. Three studies published between 2015 and 2025 measure it the same way, and the pattern holds across all three.
Each study evaluates three separate questions, which Dan framed as three projects: where you stand the day before retirement, what the plan produces for income the day after retirement, and what passes to the next generation the day after death. Comparing plans on the first question alone is the error that produces every wrong conclusion in this field.
Study one: whole life plus a single premium immediate annuity
Wade Pfau's paper, Optimizing Retirement Income by Combining Actuarial Science and Investments, compares buy-term-and-invest-the-difference against a coordinated plan using whole life during accumulation and a single premium immediate annuity at retirement. The annuity becomes usable because the death benefit replaces the capital committed to it.
In median market scenarios the coordinated household reaches retirement with 16% fewer assets, then produces 36% more income and leaves 47% more legacy at age 100. In the top 10% of investment outcomes, the coordinated household has 13% fewer assets, still produces 9% more income, and leaves 25% less legacy. That last figure is the honest cost of the strategy: if you get lucky in markets for decades, investment-only wins on legacy.
Study two: cash value as a volatility buffer
The second paper, Integrating Whole Life Insurance into a Retirement Income Plan with Emphasis on Cash Value as a Volatility Buffer Asset, tests a different mechanic. When markets are down, you draw that year's income from the policy instead of selling portfolio assets at a loss, then return to the portfolio once it recovers. Home equity through a reverse mortgage is the other buffer the literature accepts.
Median results: 13% more total value the day before retirement, 30% more income, 32% more legacy at age 100. Layer a single premium immediate annuity on top of the buffer and income rises to 54% more, with legacy still 10% ahead. A fifth scenario that draws the policy down to cost basis and then uses loans produces 62% more income. Dan's own scenario work found that six to seven years of available buffer income can move a sustainable withdrawal rate from 4% toward 6 to 8%.
Fewer assets. More income. That is the whole finding.
Study three: what happens when you chase rate of return instead
The third paper, a 2025 study referenced by David McKnight, takes the opposite approach. It treats insurance products as rate-of-return instruments rather than as coordinated tools, using indexed universal life and fixed indexed annuities. The results are a useful control group.
An 80/20 split between investments and indexed universal life produced 0.2% more income and 5.7% more legacy. Replace the indexed universal life with a fixed indexed annuity at the same 20% and income jumps to 16.4% more, with legacy essentially flat at 0.1% less. A 40/30/30 split across investments, indexed universal life, and a fixed indexed annuity landed at 13.9% more income and 10.9% more legacy. For a 65-year-old, swapping the fixed indexed annuity for a single premium immediate annuity moved legacy to 48% more.
Read those numbers next to study one and the lesson is hard to miss. When insurance is used for its rate of return, it adds 0.2% of income. When insurance is used for the death benefit and annuities are used for mortality credits, income improvements run 30 to 54%. Let the tool do what it is built to do.
06 / Head to headFour strategies, measured the same way
Measured across all three projects rather than one, the coordinated strategies beat the investment-only baseline on income in every scenario tested. The table sets the research findings side by side, with an illustrative dollar column so the percentages are legible.
| Strategy | Assets day before retirement | Retirement income vs baseline | Income on an $80,000 baseline | Legacy at age 100 |
|---|---|---|---|---|
| Buy term, invest the difference | Baseline | Baseline | $80,000 | Baseline |
| Whole life + SPIA at retirement | 16% fewer assets | 36% more | $108,800 | 47% more |
| Whole life as volatility buffer | 13% more | 30% more | $104,000 | 32% more |
| Whole life + SPIA + buffer | 13% more | 54% more | $123,200 | 10% more |
On the dollar column. The $80,000 baseline is illustrative. It is arithmetic applied to each study's reported percentage, not an output of the research. Dan's field version of the same point: moving a household from $80,000 of retirement income to $110,000 or $120,000 is ordinary work once you are willing to use more than one tool.
On the day before retirement. The whole life plus annuity household arrives at 65 with 16% fewer assets and still spends more for the rest of their life. Anyone comparing plans on net worth the day before retirement will pick the wrong one, which is exactly what the industry's dominant framing invites.
On the honest cost. In the top 10% of investment outcomes, legacy runs 20 to 47% lower for the coordinated strategies, because a compound interest curve running from 65 to 100 inside a portfolio that got lucky is hard to beat. That is a real tradeoff and we state it. The question is which outcome you want to bet three decades of income on.
The frameworks behind 2,000+ policies, in one place.
The And Asset Vault holds the calculators, design frameworks, and structuring decisions we use when we run this math for real households. Free, email-gated, no spam.
Open the Vault07 / The mathDoes the return clear the carrier's loan cost?
The return on whatever you deploy must exceed the carrier's loan cost, or you should not borrow. That single test governs every And Asset decision, and it sits underneath all the research above.
The structure of the decision is simple to state. You borrow at the carrier's loan rate. The policy keeps compounding on its full cash value, net of mortality and expense charges, adjusted for the carrier's recognition treatment. The deployed capital earns its own return. If that return is higher than the loan cost, you are ahead on the spread and one dollar has done two jobs. If it is lower, you have borrowed money to lose money slowly.
This is also where the industry's most abused talking point gets corrected. There is a real limit, and Dan named it directly: if the interest rate you are paying on the loan exceeds what the policy is producing, the arrangement falls apart. Nobody selling this strategy hard enough to be untrustworthy will tell you that.
"If you now have an interest rate you're paying on the loan that's greater than the dividend that you're receiving in the policy, it does not work. It falls apart."
A composite: the business owner who deployed at year eight
Consider a 44-year-old business owner, preferred non-tobacco, funding a cash-value-designed whole life policy at $63,500 per year with a 25/75 base-to-PUA split. That is $15,875 of base premium and $47,625 into the paid-up additions rider each year. This is a representative composite drawn from the patterns we see, not a single named client.
Through year four, cash value trails cumulative contributions, exactly as a real contract behaves. At year four the owner has put in $254,000 and holds roughly $243,700. At year five, $317,500 contributed crosses $322,100 of cash value. Break-even, no earlier.
By year eight the owner has contributed $508,000 and holds about $561,300 of accessible cash value. A value-add commercial property comes up. The owner borrows $214,000 against the policy. At an illustrative 6% loan rate, that costs $12,840 in interest the first year, paid annually rather than allowed to capitalize. The property produces $38,600 of incremental net operating income in year one and an estimated 13.8% IRR over the hold, so the spread runs $25,760 in the owner's favor in year one alone. Repayment follows a 44-month schedule funded by the property's own distributions.
The policy compounds on its full $561,300 the entire time, net of mortality and expense charges. The death benefit keeps climbing on its own curve. Neither one restarted.
One dollar. Two jobs. That is the And.
08 / Cost vs premiumWhat is lost opportunity cost, and where does the definition break down?
Lost opportunity cost is the return you gave up on money you spent, measured across the rest of your life rather than at the moment of the transaction. Bob Castiglione, who built the LEAP planning model, has calculated that a typical family incurs between $5 million and $10 million of it over a lifetime. Don Blanton frames the implication cleanly: there are two ways to improve your financial position, find higher returns and accept more risk, or become more efficient by avoiding unnecessary losses.
Apply it to the term policy from the debate. A 30-year-old woman in excellent health buys $500,000 of 30-year term at $188 per year. Total premium paid: $5,640. Using the same 8% return assumption the critics apply to investments, the forgone earnings on those premium dollars over 30 years come to roughly $23,000, and carried to age 90 the figure reaches $231,461. Add the $500,000 death benefit that never paid because she outlived the term, and the total economic cost across 30 years is roughly $24,000 per year. Not $188.
Run it at a more defensible 5% and the annual economic cost drops to about $19,000. The gap between $188 and $19,000 is the entire point. Premium is the dollar amount you pay for coverage. Cost is what the decision does to your total economic position over a lifetime.
Where Caleb pushed back, and why we are leaving it in
Caleb did not accept the framing, and the disagreement runs for a long stretch of the recording. His objection is fair: if you are going to charge the term buyer for a death benefit that never paid, you have to credit them for the difference in premium. At $188 versus $4,015, that is $3,827 a year compounding for 60 years, and at an 8% assumption it dwarfs a $500,000 death benefit by millions.
Dan agreed that a complete analysis would model both sides, and said plainly that he was isolating one variable rather than running the comparison. He also made the sharper point: 8% is not his assumption, it is the critics' assumption. His planning standard is 4 to 6% across everything you own, and a plan that works at those rates and improves when returns run higher is a better plan than one that requires a lucky sequence to function.
We are publishing the disagreement rather than editing it out because that is the honest state of the argument. Lost opportunity cost is real and almost universally ignored. It is also easy to overstate when it is applied to one side of a comparison and not the other.
"Premium is simply the dollar amount to pay for the coverage. It isn't looking at how it's impacting your total economic model over a lifetime."
09 / Where people get this wrongBlack box planning and the isolated-box problem
The dominant failure in financial planning is evaluating every financial tool as an isolated box, which makes rate of return the only variable that can move. Dan called it black box planning, and he practiced it for years before he stopped.
The mechanic is straightforward. You have an account. You assume a rate of return and apply it evenly to every year, which never happens in a real market. You decide how large the account needs to be, usually derived from a 4% withdrawal rate. Then you solve for the annual contribution. The retirement account, the college fund, the emergency reserve, and the death benefit each get their own box, and no consideration is given to how the boxes interact.
Two consequences follow. First, the only lever available is a higher return, which makes the entire industry a rate-of-return sales conversation. Second, the compound interest curve gets ignored. A curve has a startup phase, an accumulation phase, and an acceleration phase, and almost all the growth happens in the third. A 529 plan gets drained before the curve ever reaches acceleration, so compounding was never the real mechanic there.
The alternative requires inductive reasoning, which is harder than deductive reasoning, and Dan's read on why the industry avoids it was blunt: if a firm can capture your capital through the easier path, it has no commercial reason to walk you through the harder one.
"Customer number one for any business is the business. It's not you and I. I'm not saying that's wrong. If they want to stay in business, they have to be. But we have to acknowledge it."
What integration actually changes
An integrated plan coordinates the tools instead of isolating them. Whole life cash value, a death benefit used as an asset replacement so other assets can be spent down and enjoyed, an annuity replacing part of the bond allocation, a reverse mortgage held in reserve, and the investment portfolio, all positioned so that money can flow between them. That flow is what black box planning structurally cannot do, and it is where the 30 to 54% income differences in the research come from.
The same logic explains why a policy loan behaves differently from a withdrawal. Pull money out of most tools and you step off that tool's compound interest curve and start a new one somewhere else. Borrow against the policy and pay the interest and you never leave the curve.
10 / The tradeoffsWhat the research does not say
The research does not say whole life beats investing, and reading it that way is how enthusiasts discredit themselves. Four honest limits belong on the page.
First, in the top decile of investment outcomes, investment-only plans leave a larger legacy, by 20 to 47% depending on the scenario. If you are confident in a multi-decade lucky run and legacy is your only objective, the math favors the portfolio. Second, the coordinated plans hold fewer assets at retirement in several scenarios, which feels like losing right up until income starts. Third, efficiency decreases the later you start. Every one of these studies shows worse results for a 65-year-old implementing than a 35-year-old, so this is accumulation-phase work.
Fourth, and this is ours rather than the studies': none of this research measures The And Asset. It measures whole life inside a retirement income plan. Borrowing against the policy to deploy into a business or a property is a separate discipline with a separate test, and it fails the moment the deployed return stops clearing the loan cost. The research strengthens the case for the asset. It does not excuse you from the rule.
A better plan is one that works in every scenario, not the lucky one.
Universal life deserves the same evenhandedness. It is not wrong across the board, and its flexibility is real. That flexibility is also its exposure, because it belongs to both parties: the policyholder can underfund it and the carrier can adjust current cost of insurance within contractual maximums. Whole life carries fewer levers in both directions. Neither fact makes either product a scandal. Comparing whole life and term honestly requires the same discipline.
11 / The fitWhy do entrepreneurs and high-income earners use this approach?
Entrepreneurs and high-income earners use this approach because capital access on their own terms is worth more to them than the last half point of return. That is the practical argument sitting underneath the academic one.
Dan's observation from four decades of client work: most households will have two or three opportunities in a lifetime that get dropped in their lap, and if the capital is not available at that moment, the opportunity is gone. Those moments rarely arrive when markets are at highs, which is precisely when liquidating a portfolio is most expensive.
The loan mechanics are the reason the policy works as that reserve. There is no application and no underwriting. There is no stated purpose. There is no payment schedule set by anyone but you. It does not appear on a credit report. The money moves quickly. Against that, a 401(k) restricts access before 59½ under IRS rules, with narrow exceptions such as separation from service at 55 or later and plan loans on the plan's terms. That is a deliberate regulatory trade for the tax deferral, not a confiscation, and it is a real constraint on capital you might want to deploy. Our full breakdown of how the two compare goes deeper.
We have structured 2,000+ policies. We have also seen this fail.
If you have read this far and the math interests you, the next step is a conversation. We will look at your specific situation, run the numbers, and tell you honestly whether The And Asset belongs in your capital structure. We will also tell you if it does not. No pressure, no pitch. If you would rather learn first, the The And Asset and BetterWealth channels go deep on the mechanics.
Book a Discovery CallFAQQuestions about the academic case for whole life
What is the academic case for whole life insurance?
The academic case for whole life insurance rests on three things: the mechanics of the terminal reserve, peer-reviewed retirement income research, and the measurement of lost opportunity cost. The reserve explains why a level premium is possible and why the carrier is not keeping your money. The research, led by Wade Pfau, shows coordinated plans using whole life producing 30 to 54 percent more retirement income than buy-term-and-invest-the-difference in median market scenarios. Lost opportunity cost explains why premium and true cost are two different numbers.
What is a terminal reserve in life insurance?
A terminal reserve is the amount an insurance company sets aside each year toward a policy's future death benefit. It is what consumers know as cash value. The reserve exists because a level premium requires charging more than the current mortality cost in the early years to fund the higher mortality cost of the later years. As the reserve grows, the net amount at risk to the carrier shrinks.
Does the insurance company keep your cash value when you die?
No. The death benefit is paid out of two components: your terminal reserve plus the carrier's net amount at risk. Your cash value is not taken from you. It was always a deposit toward the death benefit, and the carrier covers the difference. Anyone claiming the company keeps your cash value is describing the accounting incorrectly.
What is The And Asset?
The And Asset is BetterWealth's framework for using a properly structured whole life policy as a capital base. You only borrow against it for an activity that produces a return greater than the carrier's loan cost, so your dollars do two jobs at once: the policy keeps compounding net of mortality and expense charges while the deployed capital earns its own return.
How is The And Asset different from infinite banking?
Infinite banking, as Nelson Nash taught it, frames a whole life policy as a personal banking system for any purchase. The And Asset adds a rule: you only deploy borrowed capital when the return clears the carrier's loan cost. The policy is the capital base, not the destination. It is built on Nash's foundation but operates on different principles.
What did Wade Pfau's research find about whole life insurance and retirement income?
In median market scenarios, a coordinated plan using whole life insurance and a single premium immediate annuity produced 36 percent more retirement income and 47 percent more legacy at age 100 than buy-term-and-invest-the-difference, despite holding 16 percent fewer assets the day before retirement. Using the cash value as a volatility buffer produced 30 percent more income and 32 percent more legacy. Combining the buffer with an annuity produced 54 percent more income.
What is a volatility buffer asset?
A volatility buffer is an asset you draw income from in years when the investment portfolio is down, so the portfolio is not sold at a loss and has time to recover. Whole life cash value and home equity accessed through a reverse mortgage are the two buffers most studied. With six to seven years of buffer income available, research scenarios raised the sustainable withdrawal rate from 4 percent toward 6 to 8 percent.
Is the Consumer Reports 1.5 percent return on whole life accurate?
It is accurate for what it measures, which is the guaranteed cash value of a base whole life contract, using 2015 data. It does not measure a policy designed for cash value with a heavy paid-up additions rider. Blended internal rates of return on current designs that include paid-up additions run closer to 3.25 to 3.75 percent, which puts whole life in the bond allocation conversation rather than the stock allocation conversation.
What is lost opportunity cost?
Lost opportunity cost is the return you gave up on money you spent, measured across the rest of your life rather than at the moment of the transaction. Applied to a 30-year term policy at 188 dollars per year, the 5,640 dollars of premium plus its forgone compounding, plus a 500,000 dollar death benefit that never paid, works out to roughly 24,000 dollars per year of economic cost at an 8 percent assumption. Premium and cost are two different numbers.
Why do whole life and universal life get confused in these debates?
Universal life is built on an accounting chassis that itemizes premium, interest credited, fees, and a monthly cost of insurance charge assessed on the net amount at risk. Whole life amortizes those costs into the contract on day one and does not itemize them. Critics who talk about monthly fees, rising cost of insurance, and policies lapsing are describing universal life mechanics while labeling the discussion whole life.
What is the difference between premium and cost in life insurance?
Premium is the dollar amount you pay for coverage. Cost is what the decision does to your total economic position over a lifetime, including what those dollars would have earned elsewhere and whether a benefit was ever paid. A 188 dollar annual term premium and a 4,015 dollar annual whole life premium are not comparable numbers until both are measured the same way.
Do policy loans stop the policy from compounding?
No. A policy loan is collateralized by your cash value rather than withdrawn from it, so both the cash value and the death benefit stay on their compounding curves. Under a non-direct recognition carrier the policy performs as though you had never borrowed, provided you pay the loan interest. Under a direct recognition carrier the dividend credited on the borrowed portion is adjusted by the carrier's spread, so the effect is close but not identical.
Who is whole life insurance not right for?
It is not right for someone in the early stages of building wealth, someone looking for a savings account alternative, or someone carrying high-interest debt who needs a fast fix. It is also not right for anyone who cannot name a use for borrowed capital that beats the carrier's loan cost. Under The And Asset, the discipline of deployment is the strategy, and without it the policy is an expensive place to store money.
- Wade Pfau, Retirement Researcher. Home of the research on combining actuarial science with investments and on cash value as a volatility buffer asset.
- Nelson Nash, Becoming Your Own Banker. The origin of the infinite banking concept.
- Solomon Huebner, The Economics of Life Insurance, via The American College. The foundation of human economic life value.
- IRC Section 7702 (Cornell Law). The tax code provision behind the treatment of life insurance cash value and loans.
- CFP Board Code of Ethics and Standards of Conduct. The competency standard Dan cited on when a planner must refer out.
- LIMRA. Life insurance industry data, including persistency and claims benchmarks.
- Consumer Reports. Source of the 1.5% guaranteed cash value figure discussed above (2015 data).
- Also referenced in the conversation: Bob Castiglione's LEAP model, Don Blanton's personal economic model, and Barry Dyke's Pirates of Manhattan on bank-owned and corporate-owned life insurance.
- BetterWealth resources: The And Asset book, the The And Asset YouTube channel, and the BetterWealth YouTube channel.
Nearly 40 years in the life insurance industry, including a leadership role overseeing a Fortune 300 carrier's universal life remediation program, training for thousands of agents, and continuing education instruction for Colorado CPAs on life insurance basics and evaluation. He reviewed Wade Pfau's actuarial science paper prior to publication. Dan passed away after these sessions were recorded.
I founded BetterWealth to treat life insurance as the wealth and capital tool it actually is, not the product most people get sold. Our team has structured more than 2,000 policies across all 50 states. I wrote The And Asset and host the BetterWealth and The And Asset YouTube channels. If you want an honest read on whether this belongs in your plan, book a discovery call. We will tell you if it does not.