
Life insurance carrier financial strength is measured in the statutory annual statement, not GAAP filings: how much surplus the issuing carrier holds against what it owes policyholders, and how much of its liabilities sit in affiliated or offshore reinsurance. Analyst Tom Gober looks for surplus of at least 7% of liabilities, ideally 9 to 15%.
I founded BetterWealth nearly a decade ago to treat life insurance as a wealth and capital strategy for entrepreneurs, business owners, and high-income earners. Our team has structured more than 2,000 policies across all 50 states. I wrote The And Asset and host the BetterWealth and The And Asset YouTube channels.
A former insurance examiner with 41 years examining insurance companies, including two and a half years of undercover work that led to criminal cases against executives who took policyholder money. He now converts carrier statutory filings into short risk reports through Deep Dive Analytics.
Most people who buy a cash value life insurance policy spend their diligence on the product: the base premium, the paid-up additions rider, the illustrated cash value in year 10. Very few spend any time on the balance sheet of the company making the promise. That order of priorities is backward for anyone using a policy as a multi-decade capital base, because the product is only as good as the carrier's ability to pay it out in 2060.
The risk that never shows up on an illustration is whether the carrier will still hold enough real capital to keep its promises when you need them. Tom Gober has spent 41 years examining insurance companies, first as a state examiner and now as an independent analyst who pulls statutory data from roughly 700 life and annuity carriers every year. His conclusion is direct: some carriers, particularly those controlled by private equity, are running surplus so thin, and moving so many liabilities into affiliated offshore reinsurers, that outsiders cannot tell how much capital actually stands behind the policies.
This matters more for The And Asset than for almost any other use of life insurance. The And Asset treats a whole life policy as a capital base you borrow against for decades, while the policy keeps compounding net of mortality and expense charges. Every policy loan comes out of the carrier's general account. If that account is hollow, the strategy fails at the source.
We have structured more than 2,000 policies, and carrier selection is one of the first decisions we make, before design and long before anyone borrows. What follows covers how carrier financial strength is actually measured, how offshore and affiliated reinsurance can manufacture surplus that is not real, why ownership structure changes the risk, a step-by-step carrier check, and where this fits in the rate of return math that governs every And Asset decision.
- Your legal claim runs only against the carrier named on your policy, not its holding company or affiliates.
- Statutory annual statements protect policyholders; GAAP filings are built for investors. Judge carrier strength from the statutory statement.
- Across roughly 700 carriers the average surplus is over 7% of liabilities; Gober prefers 9 to 15%.
- Ceding $10 billion of liabilities with only $6 billion of assets creates $4 billion of surplus that is not real.
- Higher-risk assets and offshore reinsurance should be measured against surplus, because every write-down comes out of surplus.
- The And Asset rule still governs: only borrow when the deployed return clears the carrier's loan cost.
Gober's talk includes the actual charts behind these numbers, including his surplus ranking of private equity carriers against mutuals and the reinsurance flow diagram that took him weeks to map. Watching him walk through them shows how much is buried in a single filing:
01 / The problemWhy Is Carrier Strength the Risk Nobody Illustrates?
Carrier strength goes unexamined because the sales process is built around the product, and the product looks identical on paper whether the company behind it is overcapitalized or running on fumes. An illustration projects cash value from a dividend scale. It says nothing about the surplus behind that scale, the quality of the assets backing reserves, or where the liabilities have been moved.
Gober puts the incentive problem bluntly. In his experience, many agents pick carriers by commission rate. The policyholder inherits that decision for 40 years.
The legal structure makes it worse. Large insurance groups report consolidated GAAP results that combine the holding company with hundreds, sometimes thousands, of subsidiaries. A policyholder has no claim against any of them. Your rightful legal claim runs only against the underwriting carrier, the name printed at the top of your policy. If that entity is thin, the strength of the parent does not help you.
Read the issuing carrier, not the brand.
"No matter how perfect the product is, what you need to do is make sure the carrier isn't going to die before your client does."
02 / The frameworkWhat Does The And Asset Require From a Carrier?
The And Asset requires a carrier that will still be solvent, liquid, and honoring its loan provisions decades from now, because the entire strategy runs through that carrier's balance sheet. The policy is the capital base. When you borrow, you are not withdrawing your own money from a separate account. You are borrowing from the carrier's general account with your cash value as collateral.
Nelson Nash pioneered the idea of using whole life as a personal banking system in Becoming Your Own Banker. His insight about the cost of interest paid to outside lenders and the cost of idle capital is the foundation we build on. The And Asset shares roots with IBC but operates on different principles.
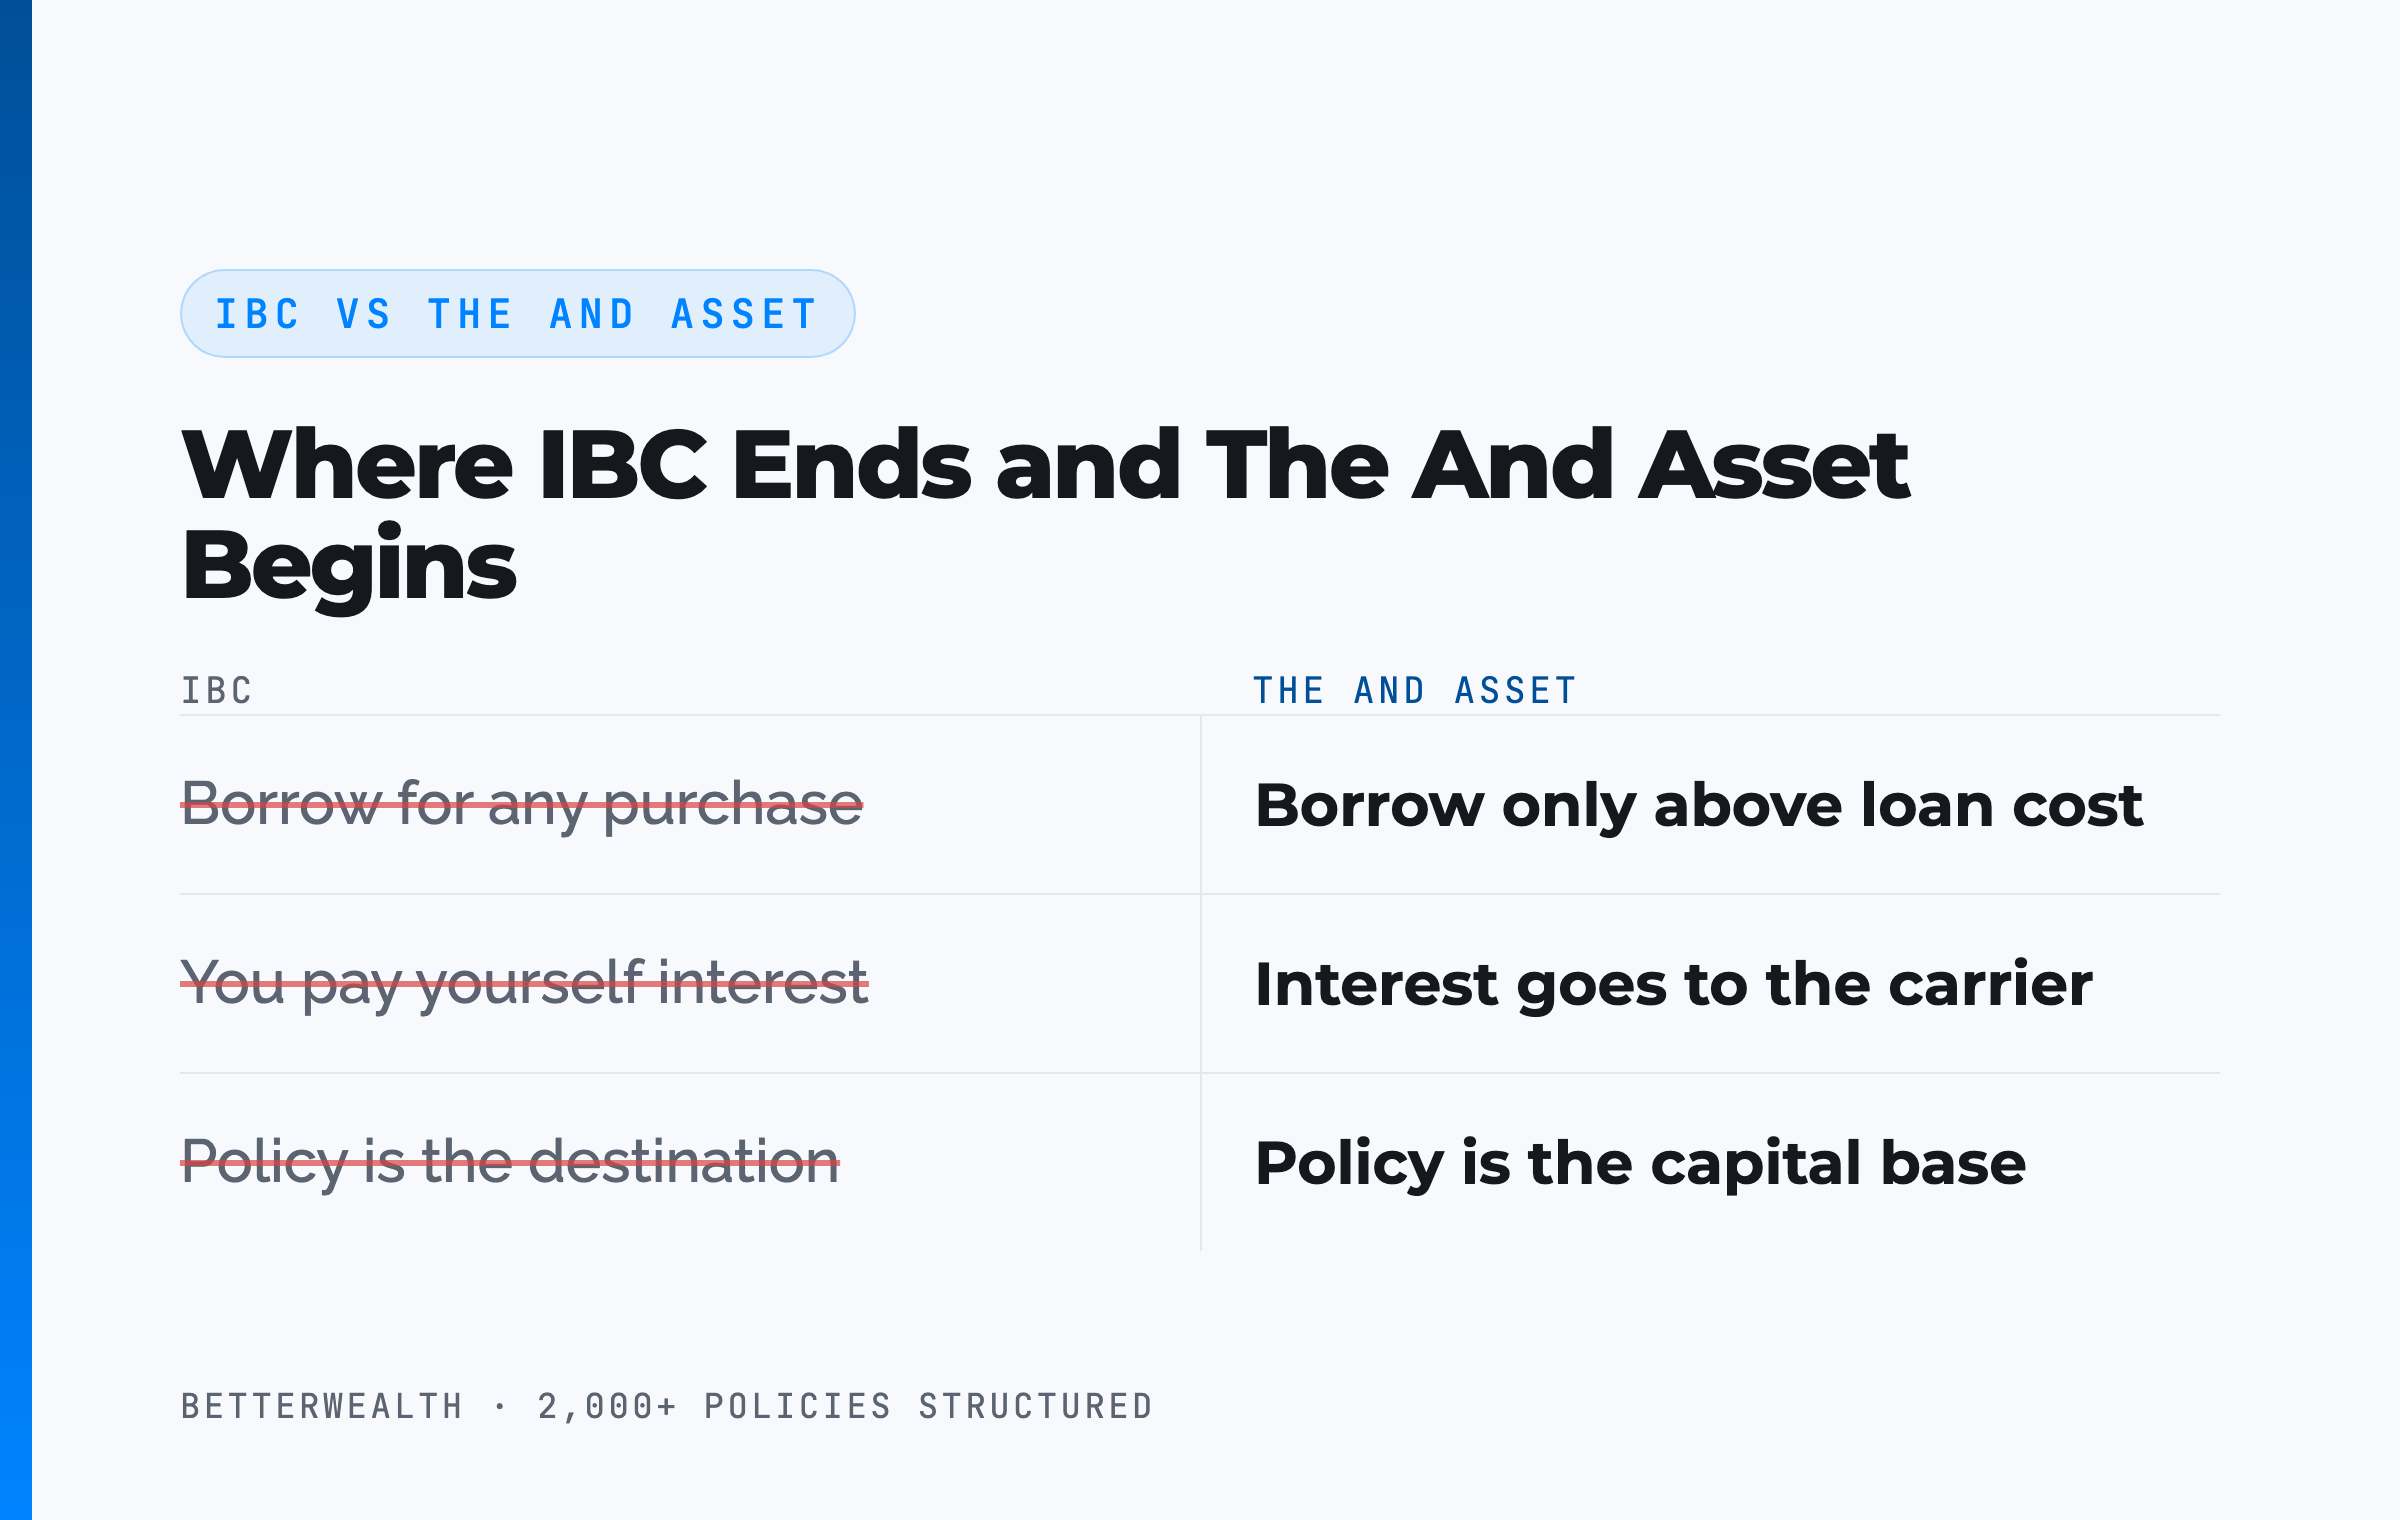
Where IBC Ends and The And Asset Begins
IBC says you can use a whole life policy as a personal banking system for any purchase. The And Asset says you only deploy capital from the policy when the borrowed dollars will produce a return greater than the carrier's loan cost, because anything less is an expensive way to spend money. IBC content often frames whole life as the destination. The And Asset frames the policy as the capital base, and a capital base is worth exactly what the institution holding it can deliver.
Many IBC marketers also say you are paying yourself interest. You are not. The interest goes to the carrier. Your return is what the deployed capital earns elsewhere while the policy keeps compounding net of mortality and expense charges. That correction is the reason carrier strength matters: the carrier is a counterparty on both sides of every loan you take.
03 / The bufferWhat Is Surplus, and How Much Should a Carrier Hold?
Surplus is the capital a life insurer holds above what it owes policyholders, and it is the only buffer between solvency and insolvency. A life and annuity company does not manufacture anything or carry inventory. It holds long-term promises and the assets set aside to pay them. Regulators do not allow a carrier to reach zero surplus, let alone go negative, so the size of that buffer relative to liabilities tells you how much room the company has before trouble.
Gober measures surplus against liabilities using statutory data from every life and annuity carrier. The national average across roughly 700 carriers is over 7%. He prefers 9, 10, or 15%. The thinnest carrier on his chart sat at 1.22%.
The pattern on that chart was not random. The carriers at the thin end were primarily private equity controlled, plus a few large publicly traded carriers. The carriers with ample surplus were mutuals. In Gober's professional opinion, private equity controlled carriers intentionally keep surplus as thin as regulators allow, because every dollar not held as surplus is a dollar the controlling group can put to other uses.
Why Statutory Accounting, Not GAAP
Statutory accounting exists to answer one question: can this company pay its policyholders? GAAP answers a different question for a different audience. It is designed for shareholders and is filed with the SEC. A carrier can look healthy under GAAP at the consolidated level while the specific entity that issued your policy carries a thin statutory buffer.
GAAP protects investors. Statutory protects you.
The stakes have widened. Insurers now take on entire corporate pension plans through pension risk transfers, so retirees who never bought a policy are depending on the same balance sheets. The buffer has to be real. A large number on paper is not enough.
04 / The mechanismHow Does Offshore Reinsurance Create Fake Surplus?
Offshore reinsurance creates fake surplus when a carrier transfers more in liabilities to an affiliated reinsurer than it transfers in assets, and the difference shows up on its own books as new surplus. Reinsurance itself is a normal tool. Its purpose is to spread risk to an outside party with its own capital. The problem begins when the reinsurer is a sister company in a jurisdiction where its finances cannot be seen.
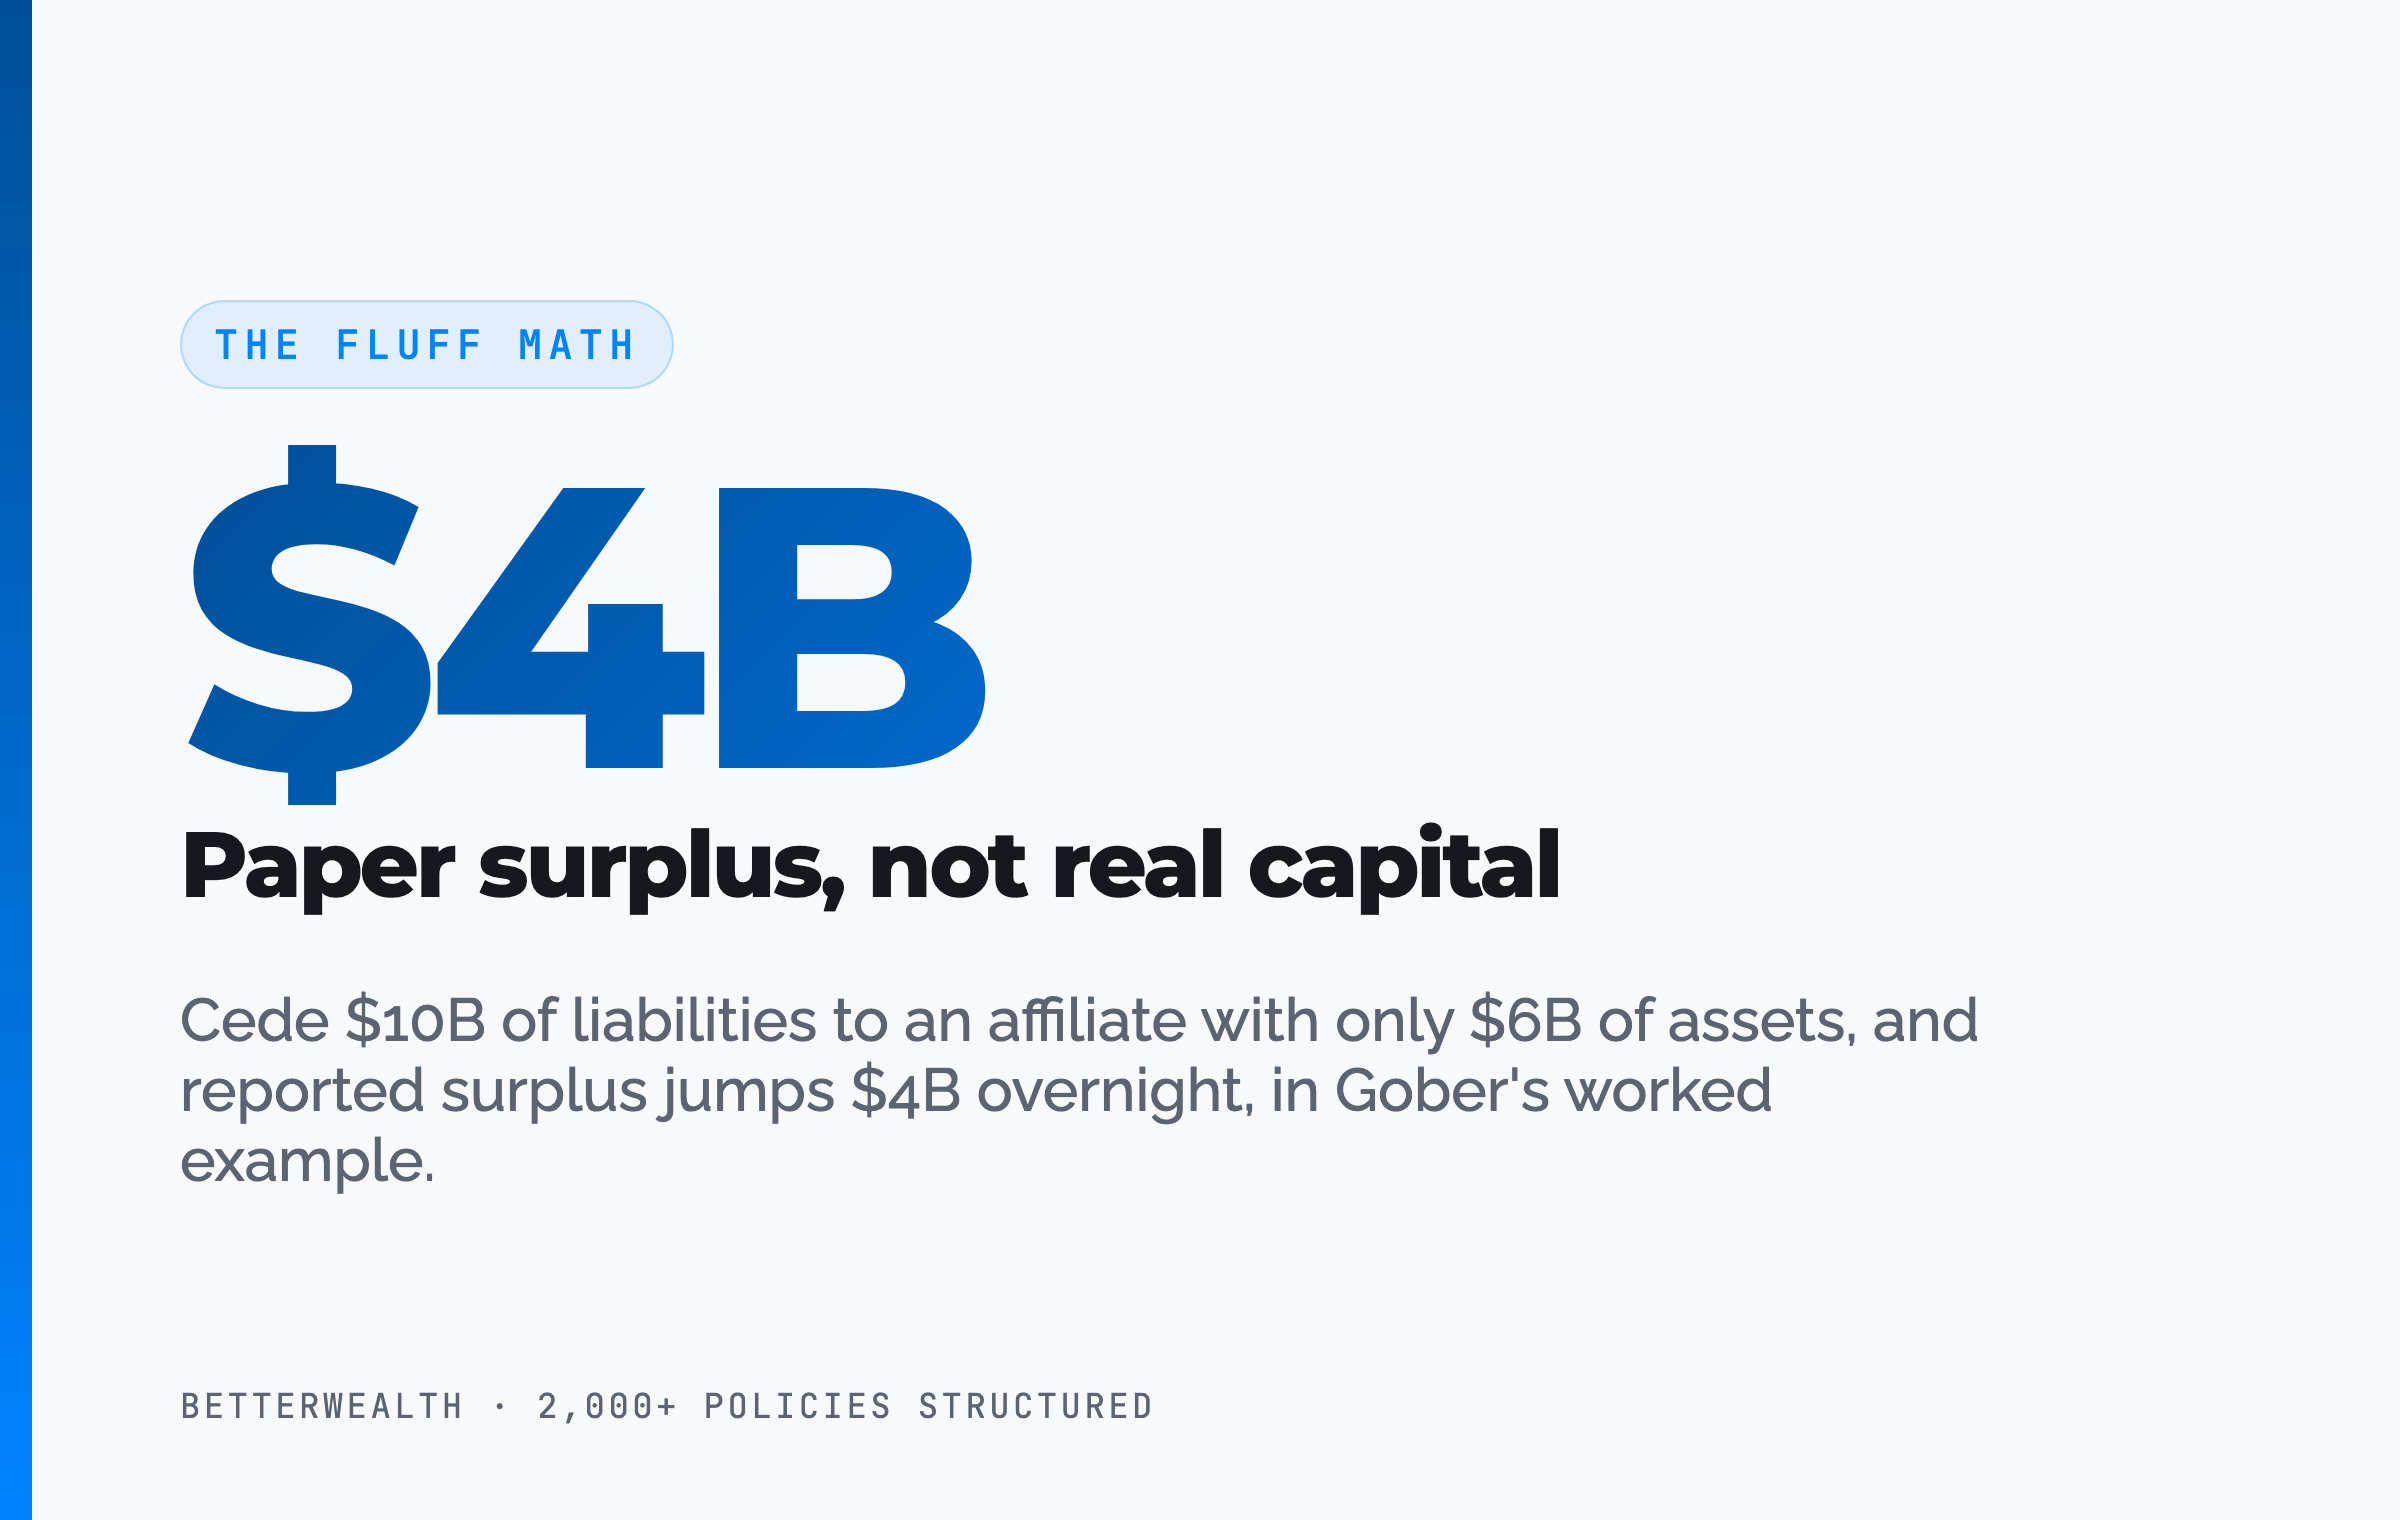
Gober's worked example is simple. A carrier cedes $10 billion of real policyholder liabilities to an affiliated captive. No independent reinsurer would accept $10 billion of obligations without $10 billion of assets. An affiliate will. The carrier sends $6 billion of assets. Its liabilities drop by $10 billion, its assets drop by $6 billion, and its reported surplus rises by $4 billion overnight.
"When 10 billion in liabilities is subtracted but only six in assets, surplus goes up by 4 billion instantaneously. But it's not real surplus. It's what I call fluff."
The hole does not disappear. It moves into a captive where policyholders, and often regulators in other states, cannot inspect it. Gober's view from four decades of examinations is that a hidden shortfall tends to grow, because nothing forces it to be filled.
The $235 Billion Concentration
The figure in the video title comes from Gober's reading of Athene's statutory annual statement, a filing that runs past 9,600 pages for one company in one year. By his analysis, Athene has ceded roughly $235 billion of liabilities to one reinsurer. He raises three concerns, in ascending order. The amount sits with a single counterparty, which defeats the purpose of spreading risk. That counterparty is an affiliate rather than an independent company with its own capital. And it is offshore, where its finances are not available to the public.
We have not audited these filings. The figures are Gober's reading of public statements, and the structure alone does not prove any carrier is insolvent. What it does mean is that outsiders cannot measure how fully those liabilities are funded, which is exactly the information a policyholder needs.
The Reinsurance Map Nobody Reads
To show how this looks inside a large group, Gober spent weeks matching columns across Schedule S, the reinsurance schedules of the statutory statement, for one publicly traded group. The result was a map of reinsurance flowing between its operating insurers and seven captives domiciled in Arizona, with single flows of $1.56 billion, $5.95 billion, and $12.6 billion circulating inside the group. A policyholder of the operating companies cannot obtain the captives' financial statements. Gober's question to anyone looking at that map: can you name a legitimate business purpose for every arrow?
The And Asset Fits a Specific Person Doing Specific Things.
It Fits You If
- You already deploy capital into business or real estate
- You can name a use for borrowed dollars that beats the loan cost
- You have a funding horizon of 10 years or more
- You want the carrier vetted before the design, not after
It Does Not Fit You If
- You want a savings account alternative
- You are carrying high-interest debt and need a quick fix
- You are choosing a carrier on the highest illustration alone
- You have no productive use for borrowed capital
If you are in the first column, a 30-minute conversation will tell you whether a policy fits and which carriers we would and would not use for it. If you already own a policy and want a second opinion on the carrier behind it, we will review that too.
Book a Discovery Call05 / How it worksHow to Check a Carrier Before You Fund a Policy
Checking a carrier takes seven steps, and the first five happen before you look at a single illustration. This is the sequence we use, built around the statutory data Gober works from.
- Identify the issuing carrier. Find the exact legal entity on the policy. Large groups run several insurers with similar names, and your claim runs only against the one that issued your contract.
- Pull the statutory annual statement. Statutory statements are filed with state regulators and are often available through the carrier or the state insurance department. Use these, not the parent's SEC filings.
- Measure surplus against liabilities. Divide capital and surplus by total liabilities. Below the 7% industry average is a yellow flag. Gober wants to see 9 to 15%.
- Trace the reinsurance. Schedule S shows business ceded to other companies. Look for large cessions to affiliates, to captives in states such as Arizona or Vermont, and to offshore jurisdictions such as Bermuda, the Cayman Islands, or Barbados.
- Compare risk to surplus, not total assets. Add higher-risk and less liquid assets to offshore reinsurance and divide by surplus. In Gober's framework, a ratio below 600% is comfortable, up to about 1,000% is tolerable, and anything above that marks a higher-risk, less transparent carrier. The safest carriers in his data sit near 40%.
- Ask the offshore question. Ask the agent, in writing, how much of the carrier's business is ceded offshore or to affiliated captives. Most agents will not know. The question then has to go to management, and how they answer is information in itself.
- Design and deploy with discipline. Once the carrier passes, design for cash value with a minimized base and a heavy paid-up additions rider, stay under the MEC limit, and only borrow for activities that return more than the loan rate.
Step five is the one the industry skips. Regulators and analysts often measure risky assets against total assets, which makes almost any exposure look small. Gober's point is that a write-down does not come out of the whole balance sheet. It comes out of surplus, and surplus is the thin layer on top.
Divide by the buffer, not the balance sheet.
06 / OwnershipWhy Does Private Equity Ownership Change the Risk?
Private equity ownership changes the risk because it puts a group with a short return horizon in control of a balance sheet that has to last for decades. A life insurer is a cash engine. Premiums arrive every day of the year, and the obligations they fund may not come due for 40 years. That float is what makes an insurer attractive to a controlling investor, and it is what the policyholder depends on.
Gober names four practices he sees as the greatest current threats to the life and annuity industry, and ownership structure drives most of them. Surplus has gotten too thin. Transparency is disappearing into captive and offshore reinsurance. Some carriers are buying ultra high-risk, illiquid investments, sometimes assets sourced from the controlling private equity group itself. And the fourth, which Gober finds most worrying, is excessive interdependence inside the group.
The Cash Cow Problem
In a tightly interdependent group, the insurer invests in its affiliates, lends to them, guarantees their obligations, and reinsures with them. While everything works, this looks efficient: no money leaves the group. When one affiliate fails, the insurer is exposed through every one of those channels at once, and because the connections sit in filings few people read, the fragility is invisible until it is not.
Gober also criticizes how some states supervise these structures. He points to permitted practices, which are state-granted exemptions from standard statutory accounting rules, and to captive reinsurers whose financial filings are not available to the policyholders whose liabilities they hold. His argument is that a regulator cannot protect policyholders from a balance sheet no one is allowed to see. Gober is explicit that the good news sits with mutual carriers and some smaller, privately held stock carriers.
The highest illustration on the table can come from the thinnest balance sheet. In Gober's view, capital a carrier is not holding in reserve can be used to make a projection look better.
The Frameworks Behind 2,000+ Policies, in One Place.
The And Asset Vault holds the calculators, design frameworks, and structuring decisions we use when we compare carriers and design policies for entrepreneurs and investors. Free, email-gated, no spam.
Open the Vault07 / The mathDoes Carrier Strength Change the Rate of Return Math?
Carrier strength does not change the core test, which is that whatever you deploy borrowed capital into must return more than the carrier's loan cost. It changes the denominator of risk underneath that test. Policy loan rates vary by carrier and rate environment. At the time of writing many carriers fall in the 5 to 6% range, but treat any specific number as a variable to verify, not a constant.
The And Asset math has two legs. At a non-direct recognition carrier, the policy keeps compounding on its full cash value, net of mortality and expense charges, while the loan is outstanding; direct recognition carriers such as Penn Mutual adjust dividends on the borrowed portion. The deployed capital earns its own return. If that return beats the loan cost, the same dollar has done two jobs. Both legs assume the carrier honors its contract for the full horizon. A weak carrier does not lower your loan rate or raise your deal's return. It puts a question mark under the policy leg of the equation for the entire time you own it.
If the deal does not clear the loan rate, do not borrow.
This is also why a small illustrated advantage is a poor reason to accept a weaker carrier. A few thousand dollars of projected cash value in year 10 is not worth uncertainty about whether the capital base exists in year 30.
A Composite: The Real Estate Investor Who Turned Down the Higher Illustration
Consider a 46-year-old real estate investor, preferred non-tobacco, ready to fund $60,000 per year into a policy. This is a representative composite, not a single named client. Two illustrations came back. One, from a private equity controlled stock carrier, projected $11,700 more cash value at year 10. Its statutory statement showed surplus at 2.3% of liabilities, with higher-risk assets and offshore affiliated reinsurance equal to 1,430% of surplus. The other, from a mutual, showed surplus at 10.8% of liabilities and a risk-to-surplus ratio of 87%. The investor chose the mutual.
The $60,000 premium splits $18,000 to base and $42,000 to the paid-up additions rider, a 30/70 design kept under the MEC limit. Year 1 cash value is $39,200, below the $60,000 paid in. At year 4, cash value of $231,800 still trails $240,000 of contributions, exactly as a real policy should. At year 5, cash value of $301,400 crosses the $300,000 contributed. No earlier.
In year 6, with $370,600 of cash value against $360,000 contributed, the investor borrows $143,500 to renovate a duplex. The renovation adds $1,410 a month in net income after vacancy, maintenance, property tax, and insurance, or $16,920 a year, an 11.8% net return on the borrowed capital. At an illustrative 5.75% loan rate, first-year interest is $8,251, so the deal clears the loan cost by about 6 points. The investor routes all $16,920 of added net income to the loan: $8,251 covers first-year interest and the remaining $8,669 pays down principal, which retires the loan in roughly 12 years from the property's own cash flow. After that, the full $1,410 a month stays with the investor. The mutual in this composite is a non-direct recognition carrier, so it keeps crediting dividends on the full cash value while the loan is outstanding; a direct recognition carrier such as Penn Mutual adjusts the dividend on the borrowed portion, and that adjustment belongs in the math before you borrow.
One dollar. Two jobs. One carrier that has to be there.
08 / The mistakesWhere Do Agents and Marketers Get Carrier Selection Wrong?
Agents and marketers get carrier selection wrong by competing on the illustration and the dividend rate, then treating financial strength as a box checked by a rating letter. Ratings from agencies such as AM Best are a useful starting point. They are not a substitute for reading what a specific issuing carrier has done with its reinsurance and its surplus.
The second mistake is quoting the dividend rate as if it were the growth rate. It is a gross figure. Cash value compounds at the dividend net of mortality and expense charges, and the dividend itself is only as durable as the surplus behind it.
The third mistake is selling around the question entirely. Gober's request to advisors is simple: when a client is considering a high-risk carrier's product, have the client ask that carrier's agent how much business goes offshore. The agent almost never knows. The question has to travel to management, which is often the first time anyone in the sale has looked.
Marketers have ruined the way this strategy should be explained, and carrier selection is part of it. A pitch that leads with the biggest projected number and never mentions the balance sheet is selling the product while ignoring the promise behind it.
Gober's position: transparency in insurance is the law. A carrier that will not show you where its liabilities went has already answered your question.
09 / The tradeoffsBenefits and Real Tradeoffs of a Strict Carrier Screen
A strict carrier screen protects the capital base, and it costs you some illustrated value and some convenience. Both sides deserve a plain statement.
The benefit is durability. A carrier with surplus at 9 to 15% of liabilities and little affiliated offshore reinsurance has room to absorb write-downs, rate shocks, and bad years without touching its promises. For a strategy measured in decades, that margin is the point.
The tradeoffs are real. First, a well-capitalized carrier may illustrate slightly lower values than a thin one, as in the composite above. Second, the screen narrows your choices: in Gober's data, the strongest balance sheets cluster among mutuals, which limits the menu. Third, the data is hard to use. A 9,600-page filing is not something most buyers will read, and the finances of captives and offshore affiliates cannot be read at all. Fourth, Gober's thresholds are one experienced analyst's framework, not a regulatory standard. They are a disciplined starting point, and a reasonable analyst could set the lines differently.
State guaranty associations exist as a backstop if a carrier fails. Their limits are set state by state and are often well below the cash value an overfunded policy accumulates, so they are not a reason to accept a weaker carrier.
10 / Head to headMutual vs Private Equity vs Publicly Traded Carriers
Compared side by side, the ownership models differ most in who the carrier answers to and how much real capital stands behind each dollar of promises. The table uses Gober's dataset for the surplus figures and translates them into dollars per $1 million of liabilities.
| Dimension | Traditional Mutual | Private Equity Controlled | Large Publicly Traded |
|---|---|---|---|
| Who It Answers To | Policyholders, who own the company | A controlling investment group seeking returns on the float | Public shareholders and quarterly earnings |
| Surplus Behind $1M of Liabilities | Mutuals cluster at the high end of Gober's chart; at 9 to 15%, that is $90,000 to $150,000 | As little as $12,200 at the 1.22% low end of his chart | Varies; several sit below the 7% average, under $70,000 |
| Reinsurance Pattern | Generally limited affiliated or offshore cession | Large cessions to affiliated offshore reinsurers are common | Can include heavy intra-group flows to domestic captives |
| Transparency to Policyholders | Statutory statement shows most of the picture | Key liabilities can sit with captives no one can inspect | Mixed; captive filings may be unavailable |
Who it answers to. A mutual has no outside shareholders, so surplus and dividends serve policyholders. A private equity owner or public shareholder base has a legitimate claim on returns, and that claim competes with the policyholder for the same capital.
Surplus. The dollar translation is the clearest way to see the gap. At 10% surplus, $100,000 stands behind every $1 million owed. At 1.22%, $12,200 does, and a single bad write-down can consume it.
Reinsurance and transparency. These two rows travel together. Reinsurance to an independent company spreads risk. Reinsurance to an affiliate in a jurisdiction without public filings moves risk somewhere you cannot see it. Ownership is a signal, not a verdict, so the specific carrier's statutory numbers still need checking.
11 / The fitHow Does Carrier Selection Fit Into a Broader Capital Strategy?
Carrier selection is the first layer of the capital strategy, and everything after it depends on that choice holding for decades. The order we follow is carrier, then design, then deployment discipline. Get the carrier wrong and a perfect design sits on a weak foundation. Get it right and the remaining decisions are about structure and math.
For entrepreneurs and investors who already deploy capital, a policy loan is one source among several, next to bank lines, home equity, and retained earnings. The And Asset earns its place in that stack through control: a loan the carrier cannot demand you repay, on a capital base that keeps compounding. The limit is real: if the loan plus accrued interest grows past the cash value, the policy lapses, and a lapse with an outstanding loan can be a taxable event. That control is only as good as the counterparty. If you already own a policy, the same check applies, and a second opinion on the issuing carrier is a reasonable step before you build more on top of it.
This is for entrepreneurs and value creators, not savers. The math has to work, and the carrier has to be there when it does.
An Honest Look at Your Carrier and Your Design.
We have structured 2,000+ policies. We have seen this strategy work exactly as designed, and we have seen it fail. If you want a real conversation about whether The And Asset fits your situation, or a second opinion on the carrier behind a policy you already own, book a call. We will give you the honest answer either way. No pressure, no pitch. If you would rather learn first, The And Asset YouTube channel and the BetterWealth YouTube channel go deep on the math.
Book a Discovery CallFAQCarrier Financial Strength Questions
How do I check a life insurance company's financial strength?
Check the issuing carrier's statutory annual statement, not its GAAP filings. Look at capital and surplus as a percentage of liabilities, the share of business ceded to affiliated or offshore reinsurers, and higher-risk assets measured against surplus. Ratings from agencies such as AM Best are a starting point, not the full picture.
What is a good surplus to liabilities ratio for a life insurer?
Former insurance examiner Tom Gober wants to see at least 7%, the approximate industry average across roughly 700 carriers, and prefers 9 to 15%. Surplus is the only buffer between solvency and insolvency, and some private equity controlled carriers in his data run near 1.22%.
What is offshore reinsurance and why does it matter?
Offshore reinsurance is when a carrier transfers liabilities to a reinsurer in a jurisdiction such as Bermuda or the Cayman Islands. It matters when the reinsurer is an affiliate with limited disclosure, because outsiders cannot verify whether enough assets went with the liabilities.
What is the $235 billion problem?
It refers to Tom Gober's reading of Athene's statutory annual statement, which in his analysis shows roughly $235 billion of liabilities ceded to a single affiliated offshore reinsurer. His concern is concentration, affiliation, and opacity: the risk is not spread, and outsiders cannot measure whether the liabilities are fully funded.
Who do I have a legal claim against if my insurance company fails?
Your claim runs against the underwriting carrier named on your policy. You cannot claim against its ultimate holding company or its affiliates, which is why the issuing carrier's own statutory balance sheet matters more than the parent's consolidated GAAP results.
Are mutual life insurance companies safer than private equity owned carriers?
In Tom Gober's dataset, mutual carriers cluster at the high end of surplus to liabilities, while private equity controlled carriers and some large publicly traded carriers cluster at the thin end. Ownership is a signal, not a guarantee, so the statutory numbers for the specific carrier still need checking.
What is a permitted practice in insurance accounting?
A permitted practice is an exemption a state regulator grants a carrier from standard statutory accounting rules. It can be legitimate, but it means the reported numbers depart from the standard in ways outsiders often cannot quantify.
What is The And Asset?
The And Asset is BetterWealth's framework for using a properly structured whole life policy as a capital base. You only borrow against it for an activity that produces a return greater than the carrier's loan cost, so your dollars do two jobs at once: the policy keeps compounding net of mortality and expense charges while the deployed capital earns its own return.
How is The And Asset different from infinite banking?
Infinite banking, as Nelson Nash taught it, frames a whole life policy as a personal banking system for any purchase. The And Asset only deploys borrowed capital when the return clears the carrier's loan cost, and it treats the policy as a capital base whose value depends on the carrier behind it. It shares roots with IBC but operates on different principles.
Does a higher dividend or illustration mean a better carrier?
No. An illustration shows what a carrier projects, not whether it holds the surplus to keep that promise for 40 years. In Gober's view, a thin-surplus carrier can use capital it is not holding in reserve to make its projections look better.
Do state guaranty associations protect my cash value?
State life and health guaranty associations provide a backstop if a carrier fails, but coverage limits are set by each state and are often below the cash value an overfunded policy accumulates. Check your state's limits through NOLHGA and do not treat the backstop as a substitute for choosing a sound carrier.
What should I ask my agent about carrier risk?
Ask how much of the carrier's business is ceded offshore or to affiliated captives, and what its surplus is as a percentage of liabilities. Most agents will not know, and the question then has to go to the carrier's management, which is itself useful information.
- Nelson Nash, Becoming Your Own Banker: the origin of the infinite banking concept.
- National Association of Insurance Commissioners (NAIC): statutory accounting principles and annual statement requirements, including Schedule S reinsurance reporting.
- National Organization of Life and Health Insurance Guaranty Associations (NOLHGA): state-by-state guaranty association coverage limits.
- AM Best: insurer financial strength ratings.
- IRC Section 7702 (Cornell Law): the tax code definition of life insurance.
- Tom Gober, The $235 Billion Problem Hiding Inside The Insurance Industry, BetterWealth YouTube: the source presentation for the figures attributed to him in this article.
- BetterWealth resources: The And Asset book, The And Asset YouTube channel, and the BetterWealth YouTube channel.
I founded BetterWealth to treat life insurance as the wealth and capital tool it actually is. Our team has structured more than 2,000 policies across all 50 states, and we choose carriers before we design anything. I wrote The And Asset and host the BetterWealth and The And Asset YouTube channels. If you want an honest read on your carrier or your design, book a discovery call. We will tell you if it does not fit.