.png)

Whole life insurance is worth it for entrepreneurs and high-income earners who need permanent death benefit, will fund the policy for a decade or more, and can deploy borrowed capital into a return that beats the carrier's loan cost. It is not worth it as a standalone investment, an early-stage savings account, or a quick debt fix.
The honest answer to whether whole life insurance is worth it depends entirely on which question you are actually asking, and most people are asking three questions at once without realizing it. They are asking whether it is worth it as insurance, whether it is worth it as an investment, and whether it is worth it as a tool to control capital. Those are three separate questions with three different answers. Blur them together and you get the noise that fills the internet: glowing testimonials on one side, scam accusations on the other, and very little that tells a skeptical buyer what is actually true.
Whole life insurance is not one thing, so it cannot have one verdict. It is worth it for a specific person doing a specific thing, and it is a poor decision for almost everyone else. The product is legitimate and heavily regulated. The marketing around it is frequently dishonest. Both of those statements are true at the same time, and holding them together is the only way to answer the question with any credibility.
At BetterWealth, we have structured more than 2,000 policies across all 50 states, and we have watched this strategy work exactly as designed and watched it fail. We are not in the business of telling everyone they need a policy. We tell people the truth, including the people we turn away. This article separates the three questions, answers each one without flinching, names the situations where whole life is a mistake, and explains the one framework under which the math actually works.
- "Is whole life worth it" is really three questions: worth it as insurance, as an investment, and as a capital tool.
- As a standalone investment competing with equities, whole life loses. We say so plainly.
- As permanent insurance with control and tax treatment, it earns its place for the right buyer.
- Cash value compounds net of mortality and expense charges, not at the gross dividend rate.
- It is not worth it for early-stage savers, temporary needs, or anyone without a use for borrowed capital.
- Under The And Asset, it is worth it only when deployed capital beats the carrier's loan cost.
01 / The real problemWhy "is it worth it" is the wrong question on its own
The question is incomplete until you specify what job you want the policy to do. A hammer is worth it for a nail and worthless for a screw, and no one writes "is a hammer worth it" think pieces because the answer obviously depends on the task. Whole life insurance gets treated differently because it has been sold as a do-everything product, which it is not.
The structural problem most buyers face is not whether whole life beats the market. It is that their capital is always spoken for. When an opportunity appears, accessing money means liquidating something, paying tax, or applying to a lender who can say no or freeze the line at the worst moment. Conventional advice answers this by telling you to keep cash on the sidelines, which carries its own cost. Idle capital is lost opportunity cost. That tension, between liquidity you can access and growth you do not want to interrupt, is the problem worth solving. Whether whole life solves it for you is the real question.
The internet argues about whole life as an investment because that is the easiest version to win or lose. The version that matters, control of capital, almost never gets discussed honestly.
02 / As insuranceIs whole life insurance worth it as insurance?
Whole life is worth it as insurance only if you have a permanent need for death benefit, which most people under 40 do not. This is the cleanest of the three answers, and it is the one agents skip past fastest because it disqualifies the most buyers.
Term insurance covers a temporary need: income replacement during working years, a mortgage, kids who will eventually be independent. It is cheap because most term policies never pay a claim. If your need expires, buy term and keep your money. We will tell you that on a call, and we have told plenty of people exactly that.
A permanent need is different. It is an estate that will owe taxes, a special-needs dependent, a business that needs liquidity at an owner's death, or a desire to pass capital to the next generation with certainty. For those needs, term insurance is the wrong tool because it ends before the need does. Whole life provides coverage that does not expire as long as the policy is funded.
If your need is temporary, buy term. We mean it.
03 / As an investmentIs whole life insurance a good investment?
Whole life insurance is not a good investment if you define a good investment as maximizing return, and we will not pretend otherwise. The internal rate of return on cash value, net of mortality and expense charges, typically lands in the low single digits over a long horizon. A diversified equity portfolio has historically returned more. Anyone comparing whole life dividends to stock market returns and selling you the policy on that basis is misleading you.
Two corrections matter here, because they are the source of most of the confusion.
First, the cash value does not compound at the dividend rate. The dividend rate is a gross figure. Your cash value grows at the dividend net of mortality and expense charges, which is a lower number, and dividends are declared annually by the carrier and are not guaranteed. If you want the mechanics of how that growth actually accrues year by year, we walk through it in detail in how whole life insurance cash value works. Understanding that mechanism is what separates a realistic expectation from a sales illustration.
Second, low early cash value is a feature of how the contract is funded, not evidence of a scam. The early years pay for the cost of insurance and policy expenses before the cash value compounds. In a properly designed policy with a heavy paid-up additions rider, cash value still runs below cumulative contributions through the early years. Break-even, where total cash value catches total contributions, typically arrives at year 5 for a healthy individual. No earlier. Any illustration showing year-one or year-two break-even is fiction.
If your only goal is the highest return on a dollar, buy index funds. Whole life is not competing for that job, and any agent who says it is has lost the plot.
So what is the investment case, if there is one?
The honest investment case is narrow and it is about characteristics, not yield. Cash value grows on a tax-advantaged basis under IRC Section 7702. Policy loans are not taxable income. The cash value is stable and does not swing with the market, which has a behavioral value during downturns. Creditor protection on cash value varies by state and can matter for high-liability professionals. None of that makes whole life an investment that beats equities. It makes it a financial asset with a different risk and control profile than a brokerage account. Calling it "an investment" sets the wrong expectation. Calling it a capital base is closer to the truth.
04 / Is it a scamIs whole life insurance a scam, or just oversold?
Whole life insurance is not a scam, but it is one of the most oversold products in personal finance, and conflating those two facts is why the skepticism runs so deep. The contract is real. It is regulated by state insurance departments, backed by carriers with century-long track records, and it does precisely what the policy document says. The scam accusation comes from the gap between what the product does and what some agents promise it does.
Three pitches deserve the skepticism they get. The claim that you "pay yourself interest" on a policy loan is false. When you borrow against a policy, the interest goes to the insurance company, not back to you. The claim that whole life returns are comparable to the stock market is false for the reasons above. The claim that everyone should own one ignores that the product fits a narrow profile. When a skeptic calls whole life a scam, they are usually reacting to one of these three pitches, and they are right to reject all three.
The product is honest. The pitch often is not.
Marketers have ruined the way this strategy should be explained. The fastest way to know whether you are being sold is to ask whether the person will tell you who it is wrong for. Most will not.
05 / As a capital toolWhat does it mean to use whole life as a capital tool?
Using whole life as a capital tool means treating the policy as a base of capital you can borrow against while it keeps compounding, rather than as an investment you are trying to outperform with. This is the third question, and it is the one where the answer can flip from "not worth it" to "worth it" for the right person. It is also where BetterWealth's framework, The And Asset, lives.
Nelson Nash pioneered the idea of using whole life insurance as a personal banking system in Becoming Your Own Banker. His core insight holds: you either lose money paying interest to outside lenders, or you lose money to the opportunity cost of capital sitting idle. We respect that foundation. The And Asset builds on it with one rule that Nash's broader teaching does not enforce.
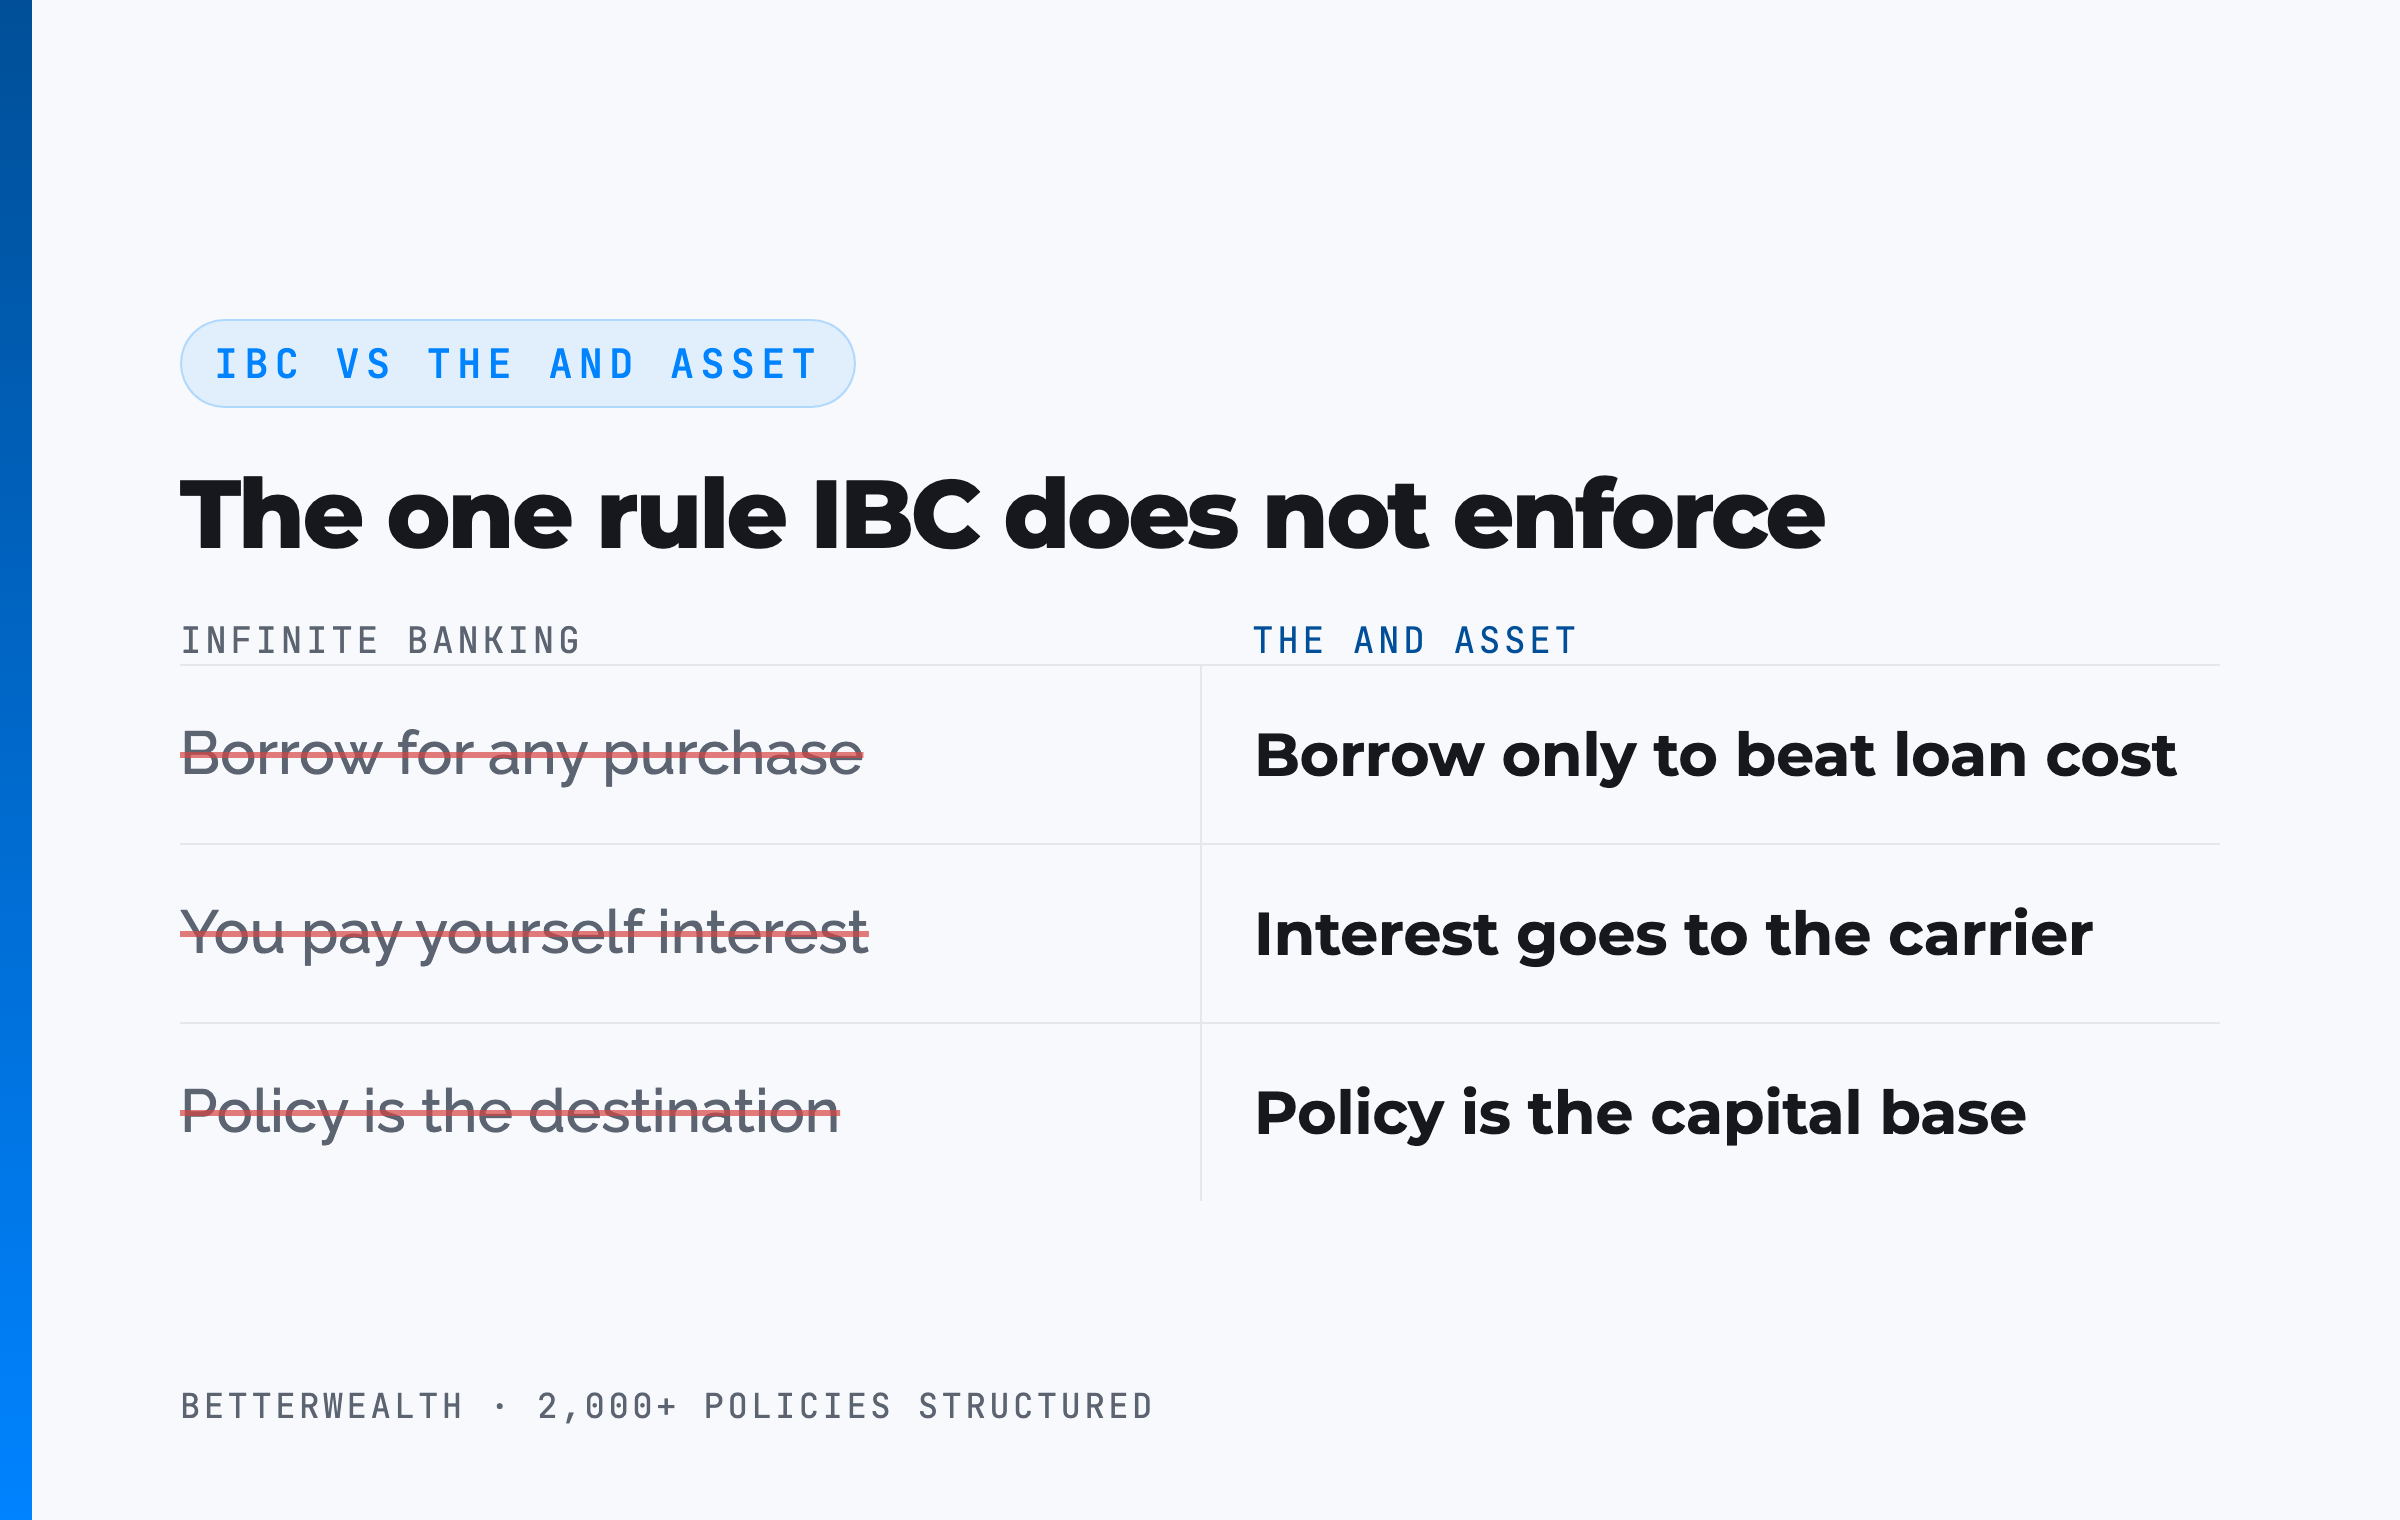
Where infinite banking ends and The And Asset begins
IBC says you can use a whole life policy as a personal banking system for any purchase. The And Asset says you only deploy capital from the policy when the borrowed dollars will produce a return greater than the carrier's loan cost. Anything less is an expensive way to spend money. Many IBC marketers say you are paying yourself interest. You are not. The interest goes to the carrier. Your return is what the deployed capital earns elsewhere while the policy keeps compounding net of its internal charges.
That distinction is the whole game. The And Asset is built on Nash's foundation but operates on different principles. If you want the full framework, the pillar guide on what infinite banking is, explained as The And Asset, lays out the mechanics end to end. Under this framing, your dollars do two jobs at once. The policy earns its own return. The deployed capital earns its own return. That is the AND.
One dollar. Two jobs. That is the test.
Whole life is worth it for a specific person doing specific things.
It is worth it if
- You have a permanent insurance need
- You can fund it for 10+ years
- You can name a use for capital that beats the loan cost
- You value control and tax treatment over maximum yield
It is not worth it if
- You are early in building wealth
- Your insurance need is temporary
- You want a savings account or a market alternative
- You cannot deploy borrowed capital productively
If you are in the first column, a 30-minute conversation will tell you whether a policy belongs in your plan and how it should be designed. If you are in the second, we will tell you that too.
Book a Discovery Call06 / The mathDoes the return clear the carrier's loan cost?
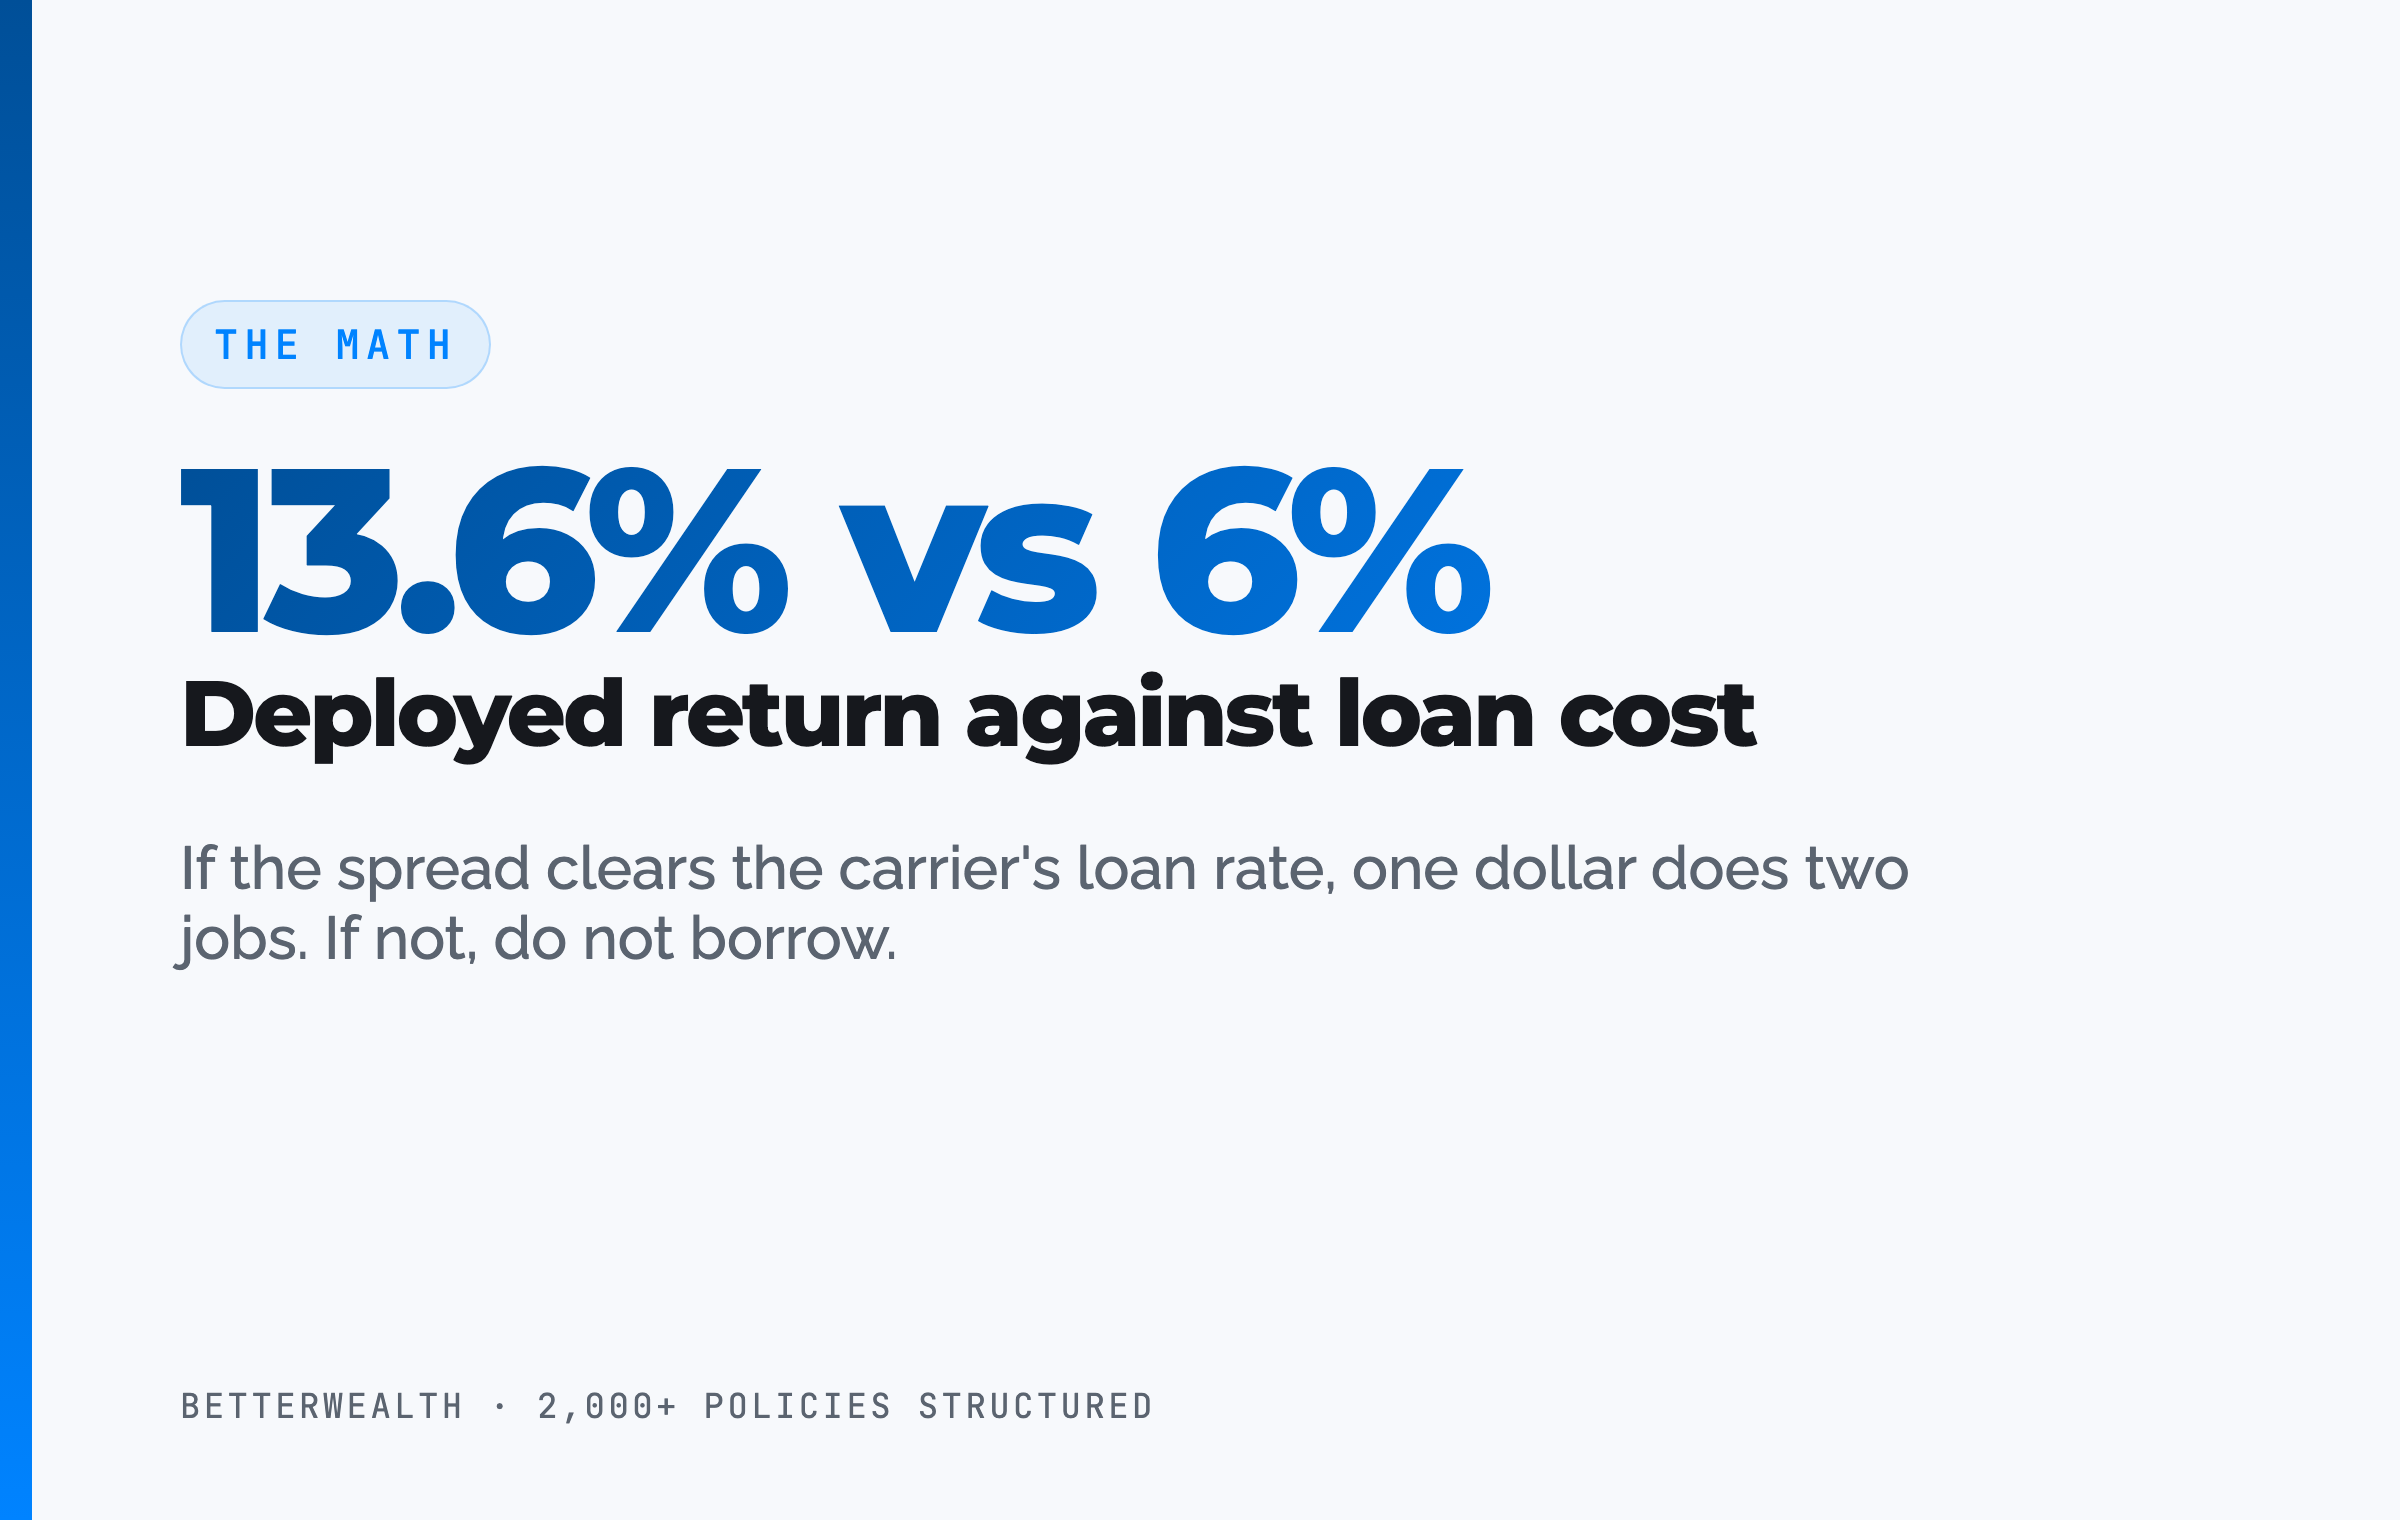
The capital-tool case holds only if whatever you deploy borrowed money into produces a return greater than the carrier's loan cost. This single test decides whether whole life is worth it for you as a capital base. Policy loan rates vary by carrier and rate environment. At the time of writing, many carriers fall in the 5 to 6% range, but treat any specific number as a variable to verify with the carrier, not a constant.
Here is the structure of the decision. You borrow against the policy at the carrier's loan rate. The policy keeps compounding on its full cash value, including the borrowed portion, adjusted by the carrier's recognition method. The capital you deploy earns its own return. If that return clears the loan cost, you are ahead on the spread, and the policy has done two jobs with one dollar. If the deployed return is lower than the loan cost, you have borrowed money to lose money slowly. There is no version of the strategy where borrowing without a productive use creates value.
If the deal does not clear the loan rate, do not borrow.
This is also why we say whole life is not worth it for someone with no use for capital. The asset is fine. The strategy that justifies its cost requires deployment. Without deployment, you own an expensive, tax-advantaged savings account, and there are cheaper ways to save.
07 / When it is not worth itThe cases where the honest answer is no
Whole life insurance is not worth it for more people than it is worth it for, and naming those cases plainly is the most useful thing this article can do. These are not edge cases. They are the majority.
It is not worth it if you are early in building wealth. The strategy compounds advantages over a long horizon and rewards consistent funding. If you cannot commit to funding it for a decade or more, the early costs work against you. Start by building income and liquidity through simpler vehicles.
It is not worth it if your insurance need is temporary. Term insurance is cheaper and correct for a need that expires. Do not buy a permanent product to solve a temporary problem.
It is not worth it as a savings account. The early cash value lag and internal costs make it a poor place to park money you might need in two years. Liquidity in the short term is not its strength.
It is not worth it as a quick fix for high-interest debt. The strategy compounds advantages over time. It does not solve an immediate liquidity crunch caused by a debt-service problem, and using it that way usually makes the problem worse.
It is not worth it if you cannot identify a productive use for borrowed capital. This is the discipline at the center of The And Asset. If you cannot name an activity that will outperform the loan cost, do not borrow, and if you will never borrow productively, you do not need the capital base in the first place.
We have turned away people who wanted to write us a check. If whole life is wrong for your situation, the right answer is no, and we would rather say it than sell you something you will resent in three years.
The frameworks behind 2,000+ policies, in one place.
The And Asset Vault holds the calculators, design frameworks, and structuring decisions we use to determine whether whole life is worth it for a given situation, and how to design it if it is. Free, email-gated, no spam.
Open the Vault08 / ComparisonWhole life against the alternatives entrepreneurs actually use
Compared to the capital tools entrepreneurs actually use, a properly designed whole life policy trades day-one liquidity and raw return for control, tax treatment, and uninterrupted compounding while borrowed against. The table sets it against term plus investing, a HELOC, and a taxable brokerage account on the dimensions that decide whether it is worth it.
| Dimension | Whole Life (And Asset) | Term + Invest | HELOC | Taxable Brokerage |
|---|---|---|---|---|
| Raw return | Low single digits on cash value, net of internal costs | Higher long-run, market-dependent | None (it is a credit line, not an asset) | Higher long-run, taxed annually on gains |
| Liquidity | Loans against cash value after policy is funded; low early cash value | Depends on the underlying investments | Fast once approved, but can be frozen or called | Fully liquid, settles in days |
| Tax treatment | Policy loans are not taxable income under IRC 7702 | Taxed per account type | Interest may be deductible in limited cases | Capital gains and dividends taxed yearly |
| Control | Loan cannot be called; you set repayment terms; compounds while borrowed | Full control of investments, no built-in leverage | Lender controls terms and can revoke access | Full control, but no leverage feature built in |
Raw return. Term plus investing and a taxable brokerage both beat whole life on raw return, and we will not argue the point. Whole life is not bought for yield. It is bought for the other three rows.
Liquidity and control. A HELOC is faster on paper, but a HELOC can be frozen exactly when you need it, as thousands of investors learned in 2020. A policy loan cannot be called. The low early cash value is the cost of access that does not disappear in a downturn.
Tax and uninterrupted compounding. Policy loans are not taxable income under Section 7702, and the policy keeps compounding on its full value while you borrow, which no credit line can do because a credit line is not an asset. That combination is the case for whole life, and it is the only case worth making.
A composite: the skeptic who ran the numbers first
Consider a 43-year-old business owner, preferred non-tobacco, who came in convinced whole life was a scam and wanted to be proven wrong before committing a dollar. She funds a maximum-cash-value policy at $48,000 per year. This is a representative composite, not a single named client.
Through the first three years, cash value trails cumulative contributions, exactly as a real policy should. By year three, each premium dollar adds more than a dollar of cash value. At year five, total cash value crosses total contributions. No earlier. The early-year lag was the single fact she had read about and assumed was fraud. Seeing it modeled honestly, with break-even at year five rather than a fictional year two, was what built her trust.
In year six, with roughly $312,000 of accessible cash value, she borrows $164,000 against the policy to buy inventory at a supplier discount that her business turns over three times a year. The deployed capital returns an estimated 13.6% IRR. The loan cost is illustrative at around 6%, so the spread works in her favor by more than seven points. The policy compounds on its full value the entire time. Repayment runs on a 38-month schedule funded by the margin the inventory generates.
She did not buy a belief. She bought a spread that cleared the loan cost.
The honest 30 minutes about whether this is worth it for you.
We have structured more than 2,000 policies across all 50 states. We have seen this strategy work exactly as designed, and we have seen it fail. On a discovery call, a practitioner looks at your specific situation and tells you honestly whether whole life belongs in your plan, and whether it does not. If you would rather learn first, the The And Asset and BetterWealth YouTube channels go deep on the math.
Book a Discovery CallFAQIs whole life insurance worth it: common questions
Is whole life insurance worth it?
Whole life insurance is worth it for entrepreneurs and high-income earners who need permanent death benefit, will fund the policy for a decade or more, and can deploy borrowed capital into a return that beats the carrier's loan cost. It is not worth it as a standalone investment, an early-stage savings account, or a quick fix for high-interest debt.
Is whole life insurance a good investment?
Whole life insurance is not a good investment if you are comparing it head-to-head with equities. The internal rate of return on cash value typically lands in the low single digits over a long horizon, net of mortality and expense charges. Its value is control, tax treatment, and uninterrupted compounding while you borrow, not a market-beating return.
Is whole life insurance a scam?
Whole life insurance is not a scam, but it is frequently oversold. The product is legitimate and heavily regulated. The problem is marketers who promise market-level returns, claim you pay yourself interest, or sell it to people who have no use for it. The contract does what it says. The pitch around it is often wrong.
What is The And Asset?
The And Asset is BetterWealth's framework for using a properly structured whole life policy as a capital base. You only borrow against it for an activity that produces a return greater than the carrier's loan cost, so your dollars do two jobs at once: the policy keeps compounding while the deployed capital earns its own return.
How is The And Asset different from infinite banking?
Infinite banking, as Nelson Nash taught it, frames a whole life policy as a personal banking system for any purchase. The And Asset adds a discipline: you only deploy borrowed capital when the return clears the carrier's loan cost. The policy is the capital base, not the destination. It is built on Nash's foundation but operates on different principles.
When is whole life insurance not worth it?
Whole life insurance is not worth it if you are early in building wealth, if you only need temporary coverage, if you want a savings account, or if you are carrying high-interest debt looking for a quick fix. It is also not worth it if you cannot identify a productive use for borrowed capital that beats the loan cost.
Why does whole life insurance have such low cash value in the early years?
Early cash value is low because the first years pay for the cost of insurance and policy expenses before the cash value compounds. In a maximum-cash-value design with a heavy paid-up additions rider, cash value still runs below cumulative contributions through the early years, with break-even typically at year 5 or later for a healthy individual.
Is whole life insurance better than term and invest the difference?
Term and invest the difference wins on pure investment return for most people, and we say so. Whole life is not competing on return. It competes on permanent coverage, control of capital, tax treatment under IRC 7702, and the ability to borrow without liquidating the asset. The two strategies solve different problems.
Does the cash value compound at the dividend rate?
No. The dividend rate is gross. Cash value grows at the dividend net of mortality and expense charges, which is the figure that actually compounds inside the policy. Dividends are declared annually by the carrier and are not guaranteed. Any agent quoting the gross dividend rate as your return is misleading you.
How long until whole life insurance pays off?
A well-designed whole life policy reaches the point where a premium dollar adds more than a dollar of cash value around year three, and break-even, where total cash value catches total contributions, typically lands at year 5 for a healthy individual. The capital-tool advantage compounds over 10 to 30 years, not in the first few.
Is whole life insurance worth it for high-income earners?
Whole life can be worth it for high-income earners who have maxed tax-advantaged accounts and want capital flexibility, asset protection that varies by state, and tax treatment under IRC 7702. It is worth it only when paired with a use for borrowed capital that beats the loan cost. Without that discipline, it is an expensive savings account.
- Nelson Nash, Becoming Your Own Banker, the origin of the infinite banking concept.
- IRC Section 7702 (Cornell Law), the tax code provision behind the tax treatment of life insurance cash value and loans.
- National Association of Insurance Commissioners (NAIC), consumer information on how whole life insurance is regulated.
- LIMRA, life insurance industry data, including ownership and persistency benchmarks.
- BetterWealth resources: The And Asset book, the The And Asset YouTube channel, and the BetterWealth YouTube channel.
I founded BetterWealth to treat life insurance as the wealth and capital tool it actually is, not the product most people get sold. Our team has structured more than 2,000 policies across all 50 states, and we tell people the truth, including the ones we turn away. I wrote The And Asset and host the BetterWealth and The And Asset YouTube channels. If you want an honest read on whether whole life is worth it for your situation, book a discovery call. We will tell you if it is not.